Excel Power Query is a powerful tool for data analysis and manipulation, allowing you to transform raw data into meaningful insights effortlessly. One of its lesser-known yet immensely useful features is the ability to split column data by a specified number of characters. This functionality is invaluable for users who frequently manage and organize voluminous datasets. Whether you are preparing data for analysis or simply trying to clean up information, learning how to efficiently split column values can significantly streamline your workflow.
Key Takeaways:
- Power Query allows efficient splitting of column data by a specific number of characters.
- Splitting columns improves clarity, sorting, filtering, and error detection.
- It’s widely used for data cleaning, marketing segmentation, and financial data structuring.
- Correct configuration of split parameters and data type management is crucial to avoid errors.
- Organizing queries, minimizing steps, and documenting transformations streamline workflows.

Table of Contents
Why Split Column Values in Power Query?
Benefits of Splitting Data in Excel
Splitting data in Excel offers several advantages that enhance both data management and analysis. By breaking down large columns into more manageable units, you increase clarity and organization, which improves data readability. This practice also facilitates easier data sorting and filtering, enabling more precise and targeted analysis. Furthermore, splitting data can aid in error detection by isolating specific data segments for closer inspection.
- Increased clarity and organization
- Enhanced sorting and filtering capabilities
- Easier data analysis
- Improved error detection
- Streamlined data processing
Common Use Cases and Applications
Splitting columns by the number of characters in Excel Power Query opens up a range of practical applications across various fields. For instance, it’s frequently used in data cleaning tasks, such as separating product codes from item descriptions or extracting postal codes from addresses. Marketing teams often employ this feature to dissect contact information into first names, last names, and email domains for targeted campaigns. In finance, it aids in dividing transaction IDs to better track and reconcile data.
- Data cleaning and organization
- Extracting identifiers like codes or tags
- Segmenting contact details for marketing
- Structuring financial data for analysis
- Preparing datasets for machine learning models
How to Split Columns by Number of Characters
STEP 1: Select your data and turn it into an Excel Table by pressing the shortcut Ctrl + T or by going to Insert > Table

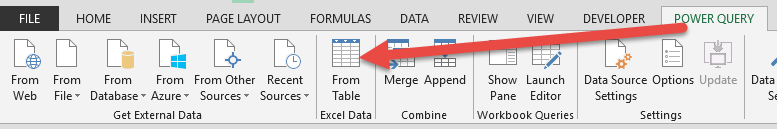
STEP 2: Go to Data > Get & Transform > From Table (Excel 2016) or Power Query > Excel Data > From Table (Excel 2013 & 2010)
Excel 2016:

Excel 2013 & 2010:
STEP 3: This will open up the Power Query Editor.
Select the column you want to split.
Go to Home > Split Column > By Number of Characters

STEP 4: Select 3 for the Number of characters, Split Repeatedly, and click OK.

STEP 5: Click Close & Load from the Home tab and this will open up a brand new worksheet in your Excel workbook with the updated table.

You now have your new table with the separated columns!

Navigating Challenges and Finding Solutions
Common Mistakes and How to Avoid Them
Mistakes during data transformation can lead to inefficient processes or inaccurate results, but being aware of common pitfalls can help you sidestep them.
- Ignoring Data Quality: Before splitting columns, scrutinize your data for inconsistencies or errors, such as irregular delimiters or unexpected characters. Clean your data beforehand to ensure smooth transformations.
- Misconfiguring Split Parameters: It’s easy to mistakenly set the wrong number of characters for a split, leading to incorrect segmentations. Double-check your settings by previewing the split results in Power Query.
- Neglecting Data Types: After splitting, failing to adjust column data types can cause issues in later stages, such as during calculations or data merges. Immediately set the correct data type as part of your workflow.
- Overlooking Edge Cases: Edge cases, like very short or empty strings, can unexpectedly impact the consistency of your split columns. Incorporate logical checks or conditional clauses to capture these anomalies.
- Forgetting to Save and Back Up: Always save and back up your data transformations frequently, especially before applying significant changes. This precaution ensures you don’t lose important work and can easily revert if needed.
Avoid these common errors by implementing a careful review process and employing consistent best practices throughout your data transformation workflow. This attention to detail not only enriches the quality of your data but also enhances the reliability of your analytical outcomes.
Tips for Efficient Data Management in Power Query
Effective data management in Power Query is essential for optimizing your workflow and ensuring accurate results. Here are some valuable tips to achieve efficiency:
- Organize Queries: Keep your workspace tidy by naming and grouping queries logically. This organization makes it easier to navigate complex projects and locate specific queries quickly.
- Minimize Steps: Reduce the number of transformation steps whenever possible. Consolidating similar actions or eliminating redundancies boosts performance and makes troubleshooting simpler.
- Document Transformations: Regularly document your transformation steps and rationale, either directly in Power Query using comments or in a separate file. This practice aids collaboration and provides a reference for future adjustments.
- Manage Memory: Large datasets can be resource-intensive. Limit preview data to essentials and avoid loading unnecessary columns or rows into memory to maintain optimal performance.
- Regularly Refresh Data: Implement scheduled refreshes for data sources updated frequently. This approach ensures your analyses always reflect the most current information without manual intervention.
By adopting these strategies for efficient data management, you can streamline your processes, improve accuracy, and maximize the capabilities of Power Query.

FAQs
What is Power Query’s main advantage for data splitting?
Power Query’s main advantage for data splitting lies in its robust, user-friendly interface that allows for efficient and flexible data transformation. It supports complex operations like splitting by characters with precision and enables seamless integration with other data transformation tools, enhancing overall data management and analysis capabilities.
Can I reverse the split columns back into a single column?
Yes, you can reverse split columns back into a single column in Power Query using the “Merge Columns” feature. This process allows you to reassemble the data into its original format by selecting the columns to merge and specifying a delimiter. This capability helps maintain data integrity and flexibility in data handling.
How do I avoid errors when splitting columns?
Common errors include ignoring inconsistent data, misconfiguring split parameters, and overlooking data types. Always clean your dataset first, check the number of characters for splitting, and adjust data types after splitting. Edge cases like empty or short strings should be handled with conditional logic. Regularly saving and backing up your work prevents data loss.
What are typical use cases for splitting columns?
Splitting columns is used for data cleaning, extracting product codes or IDs, segmenting contact information, structuring financial data, and preparing datasets for machine learning. Marketing teams, finance analysts, and data scientists benefit from this feature. It helps isolate relevant information and improves data usability. It also reduces manual editing and errors. Efficient column splitting accelerates reporting and analysis tasks.
How can I make Power Query workflows more efficient?
Organize queries with clear names and logical grouping to navigate complex projects easily. Minimize transformation steps and avoid redundancies to boost performance. Document changes for collaboration and future reference. Limit preview data and avoid loading unnecessary rows to manage memory effectively. Schedule automatic refreshes to keep analyses up to date without manual intervention.

Bryan
Bryan Hong is an IT Software Developer for more than 10 years and has the following certifications: Microsoft Certified Professional Developer (MCPD): Web Developer, Microsoft Certified Technology Specialist (MCTS): Windows Applications, Microsoft Certified Systems Engineer (MCSE) and Microsoft Certified Systems Administrator (MCSA).
He is also an Amazon #1 bestselling author of 4 Microsoft Excel books and a teacher of Microsoft Excel & Office at the MyExecelOnline Academy Online Course.


