Tables in Excel are powerful for managing data, but sometimes you no longer need table features such as automatic formatting, filters, or structured references. In those cases, you may want to convert the table back into a normal range or completely delete it. This guide will show you different ways how to remove a table in Excel while keeping or discarding the underlying data.
Key Takeaways
- Tables can be removed by converting them to a normal range.
- You can keep the data but remove table formatting and functionality.
- Deleting a table removes both the data and formatting.
- Right-click menus, Ribbon options, and VBA macros can all handle table removal.
- Power Query can be used for cleaning data without tables.
Table of Contents
What does removing a table mean in Excel
Removing a table in Excel can mean two different things. You may want to convert the table to a normal range so the data remains intact but without the table design, structured references, or auto-expanding behavior. Or you may want to delete the table entirely, which removes both the data and the formatting. Excel gives you control over both approaches depending on your needs.
How to remove a table in Excel
1. Convert table to range:
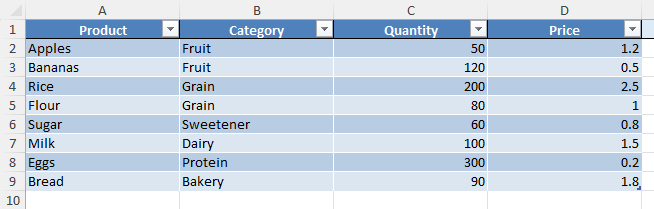
Click anywhere inside the table.
Go to the Table Design tab on the Ribbon.
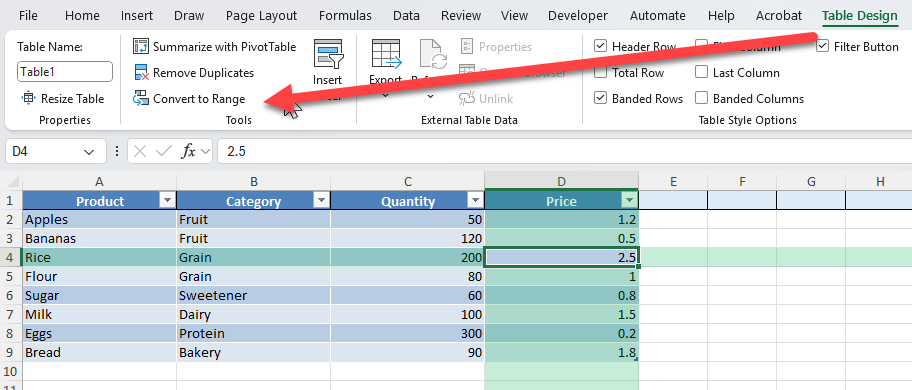
Click Convert to Range. Confirm when prompted.
2. Remove formatting:
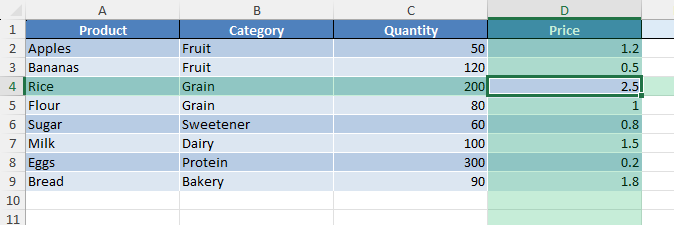
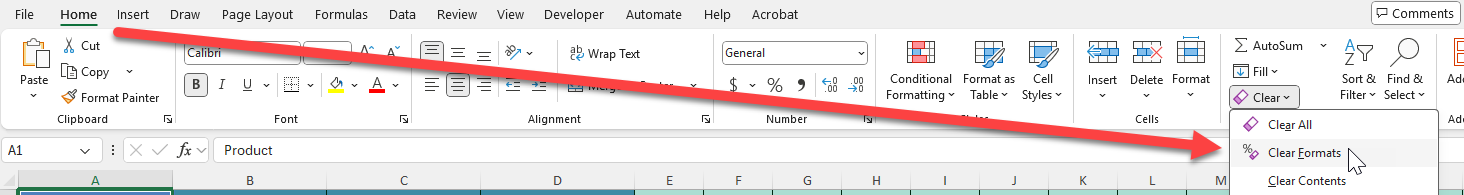
After converting to a range, you may still see colored shading. Select the range and use Clear Formats from the Home tab.
3. Delete table and data:
Select the entire table and press Delete. This removes both the table and its data.
4. Using VBA:
Sub RemoveTable()
    Dim ws As Worksheet
    Dim lo As ListObject
    Set ws = ActiveSheet
    For Each lo In ws.ListObjects
        lo.Unlist 'Converts the table back to a normal range
    Next lo
End Sub
Common mistakes and tips
Formatting remains: Converting to a range does not automatically clear table formatting. Use Clear Formats for a plain dataset.
Deleting vs converting: Pressing Delete removes both the table and its data. Use Convert to Range if you want to keep data.
Named ranges still exist: Even after removing the table, the table name may remain in Name Manager. Clean it if unnecessary.
Formulas with structured references: After converting, formulas may break if they referenced the table by name. Replace structured references with cell references.
Bonus tips and advanced scenarios
Remove all tables in a workbook: Run a VBA loop across all sheets to unlist every table at once.
Use Power Query for data cleanup: Instead of removing tables manually, load them into Power Query and output results as a simple range.
Apply custom styles: After removing a table, apply your own formatting such as conditional formatting or cell styles for consistent reporting.
Automate formatting removal: Use a VBA macro with Selection.ClearFormats to instantly strip table shading.
Use cases
Data cleanup. Remove tables before exporting data to other systems that require plain ranges.
Why it matters: Many external tools, such as databases or CSV export processes, cannot handle Excel tables with filters, formatting, and structured references. They expect plain ranges of data.
How to do it: Convert the table to a range via the Table Design tab and choose Convert to Range. If additional formatting remains, apply Clear Formats from the Home tab.
Practical add-on: Automate cleanup with a VBA macro that unlists all tables and clears formats in one step. This ensures data is always in plain range form before exporting.
Benefit: Guarantees compatibility with external systems, reduces export errors, and ensures a smoother workflow when transferring data.
Report formatting. Convert tables into ranges for a cleaner look in presentations or dashboards.
Why it matters: While tables are excellent for analysis, their banded rows, filter buttons, and color styles may distract from the polished appearance needed in reports or dashboards.
How to do it: Convert the table into a range, then apply consistent cell styles or custom formatting aligned with your report theme.
Practical add-on: Use conditional formatting after converting to highlight key values without the table’s pre-applied design.
Benefit: Provides a professional look suitable for stakeholders, making reports easier to read and visually consistent with corporate branding.
Formula troubleshooting. Simplify formulas by converting tables so they use standard cell references instead of structured references.
Why it matters: Structured references like =SUM(Table1[Quantity]) can confuse users who are unfamiliar with table syntax. Standard formulas such as =SUM(C2:C100) are easier to follow for most users.
How to do it: Convert the table to a range and update dependent formulas to use normal cell references. This makes formulas clearer and reduces errors when sharing workbooks with others.
Practical add-on: Use Find and Replace (Ctrl+H) to quickly swap structured references with standard ranges after converting.
Benefit: Improves workbook maintainability and ensures formulas are transparent for all users, especially in collaborative environments.
FAQ
1. What is the difference between deleting and converting a table?
Deleting removes both data and formatting. Converting to range keeps data but removes table functionality.
2. How can I clear table formatting after converting?
Select the range, go to Home > Clear > Clear Formats.
3. Will formulas break if I remove a table?
Yes, if they use structured references. Update them to use standard cell references.
4. Can I remove multiple tables at once?
Yes, use a VBA macro that loops through all tables in a sheet or workbook.
5. Do Power Query tables need to be removed?
No, Power Query outputs can be set as a table or a range depending on your preference.

John Michaloudis is a former accountant and finance analyst at General Electric, a Microsoft MVP since 2020, an Amazon #1 bestselling author of 4 Microsoft Excel books and teacher of Microsoft Excel & Office over at his flagship MyExcelOnline Academy Online Course.


