When I first started using Excel, I thought charts were just about making numbers look pretty. But over time, I realized they’re actually powerful tools for understanding data. One chart I’ve found especially useful is the Stacked Column Chart. It helps me compare contributions to a total in a simple, visual way.
In this article, I’ll walk you through how the stacked column chart works, why I prefer it over other charts in certain scenarios, and how to set it up correctly in Excel. I’ll also share a few tips and real-world examples from my own work.
Key Takeaways:
- Stacked Column Charts show both totals and individual contributions in one view.
- They are ideal for tracking how parts change proportionally over time.
- Building a stacked column chart in Excel is simple using the Insert > Column or Bar Chart menu.
- Customizing colors, labels, and legends improves readability and presentation quality.
- While great for trends, they can become cluttered and hard to read with too many categories.
download workbookStacked-Column.xlsx
Table of Contents
Understanding the Stacked Column Chart
What is a Stacked Column Chart?
A stacked column chart is a type of Excel chart that displays data in vertical bars. Instead of showing separate bars for each category, it “stacks” them on top of each other in a single column. Each section of the stack represents a contribution to the total.
For example, let’s say I want to analyze sales performance. Instead of plotting North sales and South sales side by side, the stacked column chart places them on top of each other. That way, I get a clear view of total sales, along with how much each region contributed.
This chart is especially helpful when I want to:
- Show how parts add up to a total.
- Compare contributions across categories (like years or products).
- Spot trends in proportions over time.
Why I Prefer It Over Regular Column Charts
At first, I used regular column charts for everything. They’re great for comparing values side by side, but they don’t tell me the whole story when I’m trying to analyze contributions.
For example, if North sales are 50 and South sales are 100, a regular chart will just show me two separate bars. But with a stacked chart, I instantly see that North contributed one-third and South contributed two-thirds to the total of 150. In other words, the stacked column chart gives me both individual performance and overall totals at a single glance. That dual perspective saves me from doing extra calculations or switching between charts.
Creating a Stacked Column Chart in Excel
Step-by-Step Guide
Once my data is ready, building the chart itself is actually pretty straightforward. Let me walk you through the steps I follow.
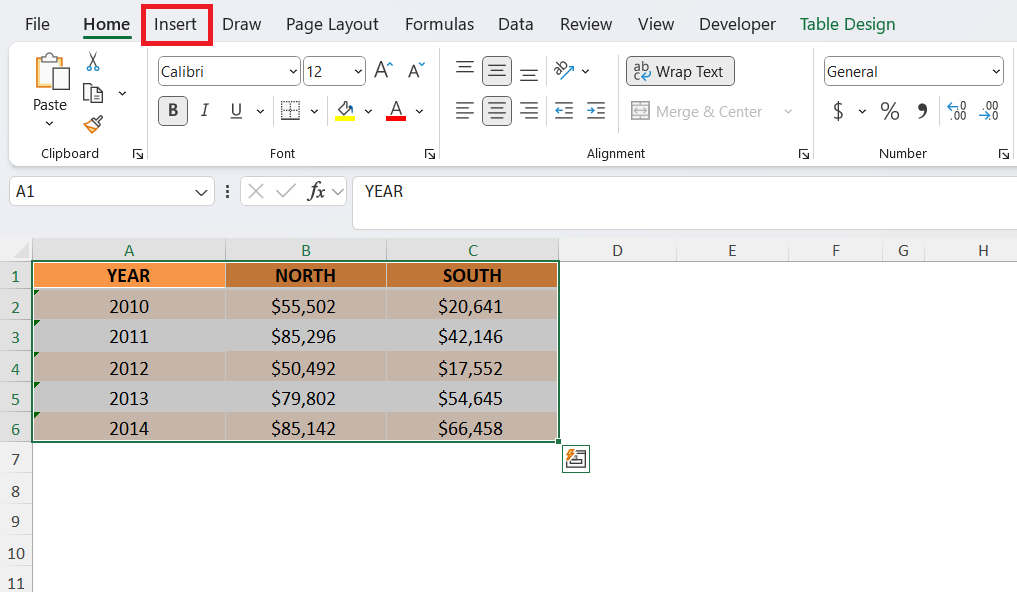
STEP 1: Select the entire dataset, including the column headers. Go to the Insert tab on the Ribbon.
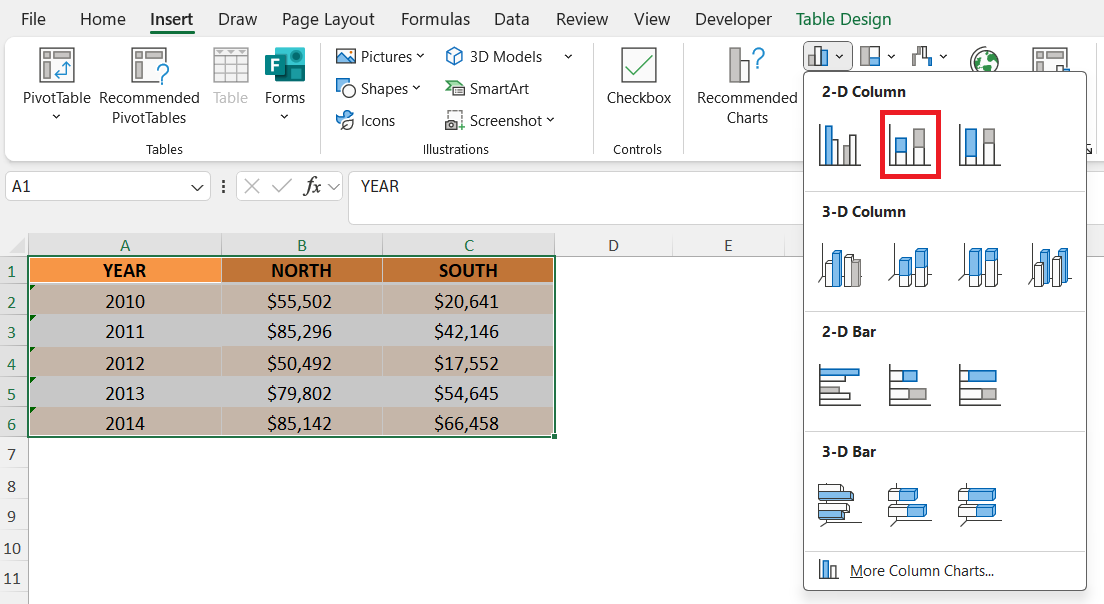
STEP 2: Under the Charts group, I click on Insert Column or Bar Chart. From the drop-down menu, I select Stacked Column.
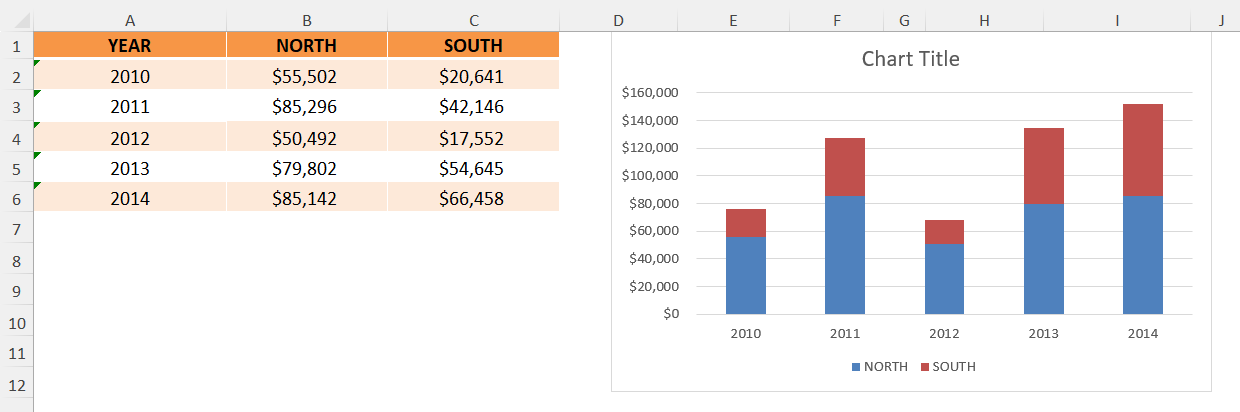
Excel immediately generates the chart, showing stacked contributions for each year. Within seconds, I can see both the totals and the individual contributions stacked neatly on top of each other.
Customizing the Chart
By default, Excel gives me a plain version of the chart. That’s fine for quick analysis, but if I’m preparing a report or presentation, I like to polish it a bit. Some things I usually tweak:
- Chart Title: I rename it to something meaningful, like North & South Sales Over 5 Years.
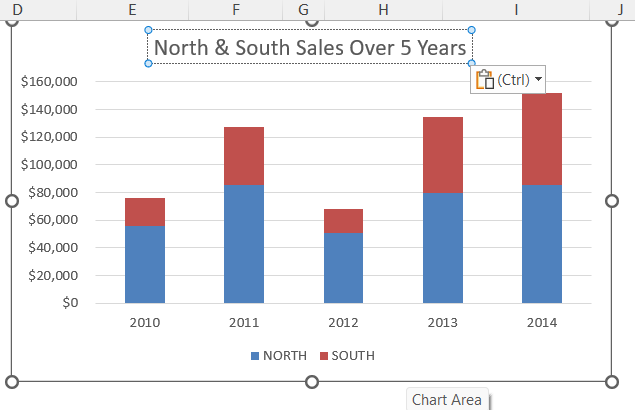
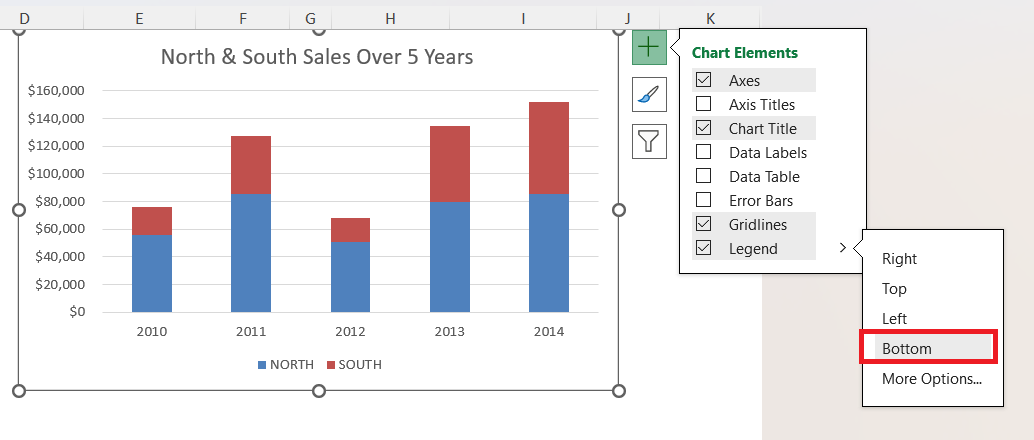
- Legend: I position it at the bottom so it doesn’t overlap with the columns.
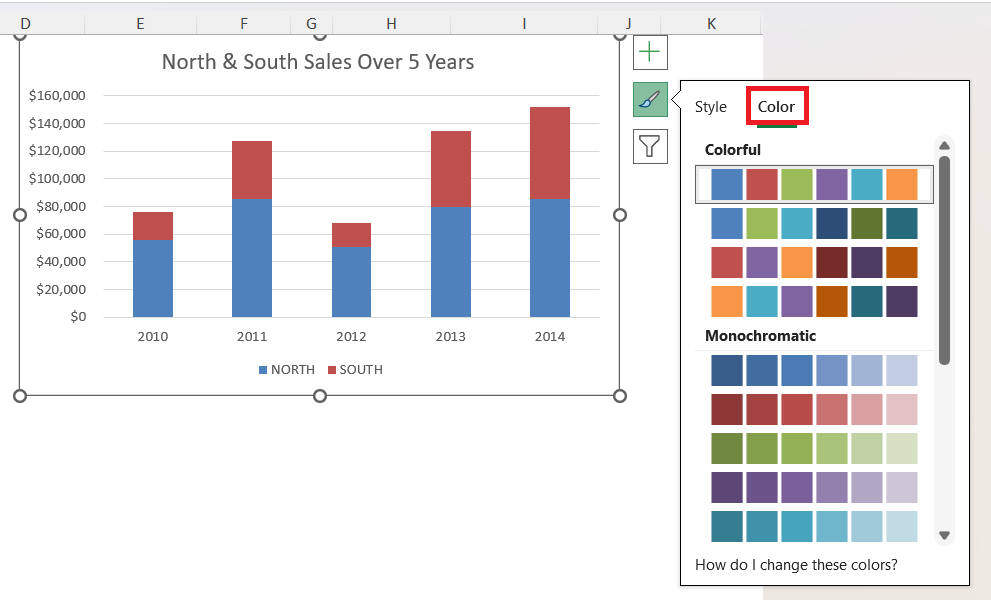
- Colors: I assign distinct colors (like blue for North and orange for South) to make it easy to tell contributions apart.
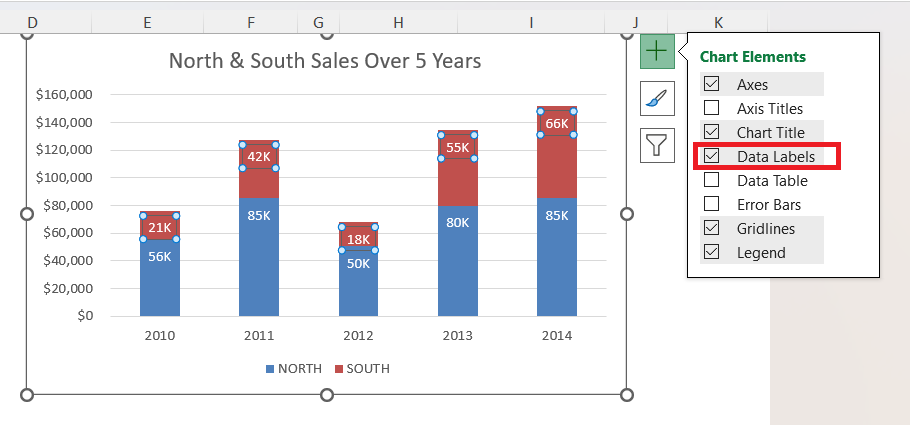
- Data Labels: I sometimes add them inside the bars to display exact values.
These small customizations make the chart much easier to read and more professional-looking.
Understanding the Impact of Stacked Column Charts
Advantages of Using Stacked Column Charts
Every chart in Excel has its own strengths, and the stacked column chart shines in certain scenarios. Some of the biggest advantages include:
- Shows totals and parts together – I can see overall totals while also understanding how each part contributes to that total.
- Highlights proportional changes over time – Even if totals increase, I can track how contributions shift (e.g., North sales growing from 40% to 50% of the total).
- Saves time and effort – I don’t need two separate charts for totals and contributions, since this chart combines both in one view.
- Makes trends easy to spot – Growth dynamics and long-term shifts stand out visually without extra calculations.
Limitations of Stacked Column Charts
Of course, no chart is perfect. The stacked column chart also comes with a few drawbacks:
- Hard to compare individual segments – Since only the bottom category has a common baseline, comparing other segments across different years can be tricky.
- Becomes messy with too many categories – Adding five or six contributions per column makes the chart cluttered and difficult to read.
- Not ideal for precise analysis – It’s great for spotting patterns, but if I need exact comparisons of individual parts, another chart type (like clustered column) works better.
- Limited readability in presentations – If the chart is crowded or viewed on a smaller screen, stacked sections may blur together and reduce clarity.
FAQs
1. What is a stacked column chart in Excel?
A stacked column chart displays data in vertical bars where each bar is divided into segments. Each segment represents a part of the total. Unlike regular column charts, it shows both the individual contributions and the overall total. This makes it easier to understand proportions at a glance. It’s especially useful for comparing contributions across categories like years or products.
2. When should I use a stacked column chart instead of a regular column chart?
Use a stacked column chart when you want to show both totals and individual contributions together. Regular column charts are better for comparing standalone values side by side. Stacked charts help visualize proportions, growth trends, and contribution shifts over time. They save you from creating multiple charts for totals and parts. For instance, sales contributions from different regions are perfect for this chart type.
3. How do I create a stacked column chart in Excel?
First, select your entire dataset, including headers. Go to the Insert tab and click on Insert Column or Bar Chart. From the drop-down, choose Stacked Column. Excel automatically generates the chart with all contributions stacked in a single column per category. You can then customize it by changing titles, colors, and adding data labels for clarity.
4. What are the advantages of using a stacked column chart?
Stacked column charts show totals and parts simultaneously, making trends easy to spot. They help track proportional changes over time and save time by combining totals and contributions in one chart. Customizing them makes insights visually clear and professional. They are ideal for reports and presentations where visualizing the big picture alongside details is important.
5. What are the limitations of stacked column charts?
Comparing segments other than the bottom one is tricky because they don’t share a common baseline. Charts with too many categories or contributions can become cluttered. They are not ideal for precise numerical analysis. Small screens or crowded presentations may reduce readability. In such cases, clustered column charts or separate charts may work better.

John Michaloudis is a former accountant and finance analyst at General Electric, a Microsoft MVP since 2020, an Amazon #1 bestselling author of 4 Microsoft Excel books and teacher of Microsoft Excel & Office over at his flagship MyExcelOnline Academy Online Course.


