A spreadsheet in Excel is a robust tool designed to help users manage and calculate data efficiently. Whether you’re organizing personal finances, analyzing large datasets, or creating detailed reports, Excel offers a versatile solution for various data management needs. This guide is crafted with beginners in mind, aiming to simplify the complex world of spreadsheets and provide a clear path to mastering Excel’s core concepts and functionalities. Here, we’ll explore fundamental topics such as spreadsheet basics, navigating Excel’s interface, and leveraging its powerful features for both everyday and professional applications.
Key Takeaways:
- Spreadsheets in Excel help organize, calculate, and analyze data using rows, columns, and formulas.
- Core components include cells, formulas, sheet tabs, and the Ribbon for efficient data management.
- The Quick Access Toolbar and command groups streamline navigation and enhance workflow efficiency.
- Basic formulas like SUM(), AVERAGE(), and IF() simplify calculations and decision-making.
- Excel is widely used for budgeting, academic tracking, business analytics, and project management.
Table of Contents
Understanding Spreadsheet Basics
Definition and Purpose
A spreadsheet in Excel is a digital sheet consisting of rows and columns used to organize, calculate, and analyze data. Each cell within the grid can contain text, numbers, or formulas, making spreadsheets versatile tools for a wide range of tasks. The primary purpose of Excel spreadsheets is to facilitate data management and simplify complex calculations.
By allowing users to enter data systematically, apply functions, and visualize results through charts and graphs, spreadsheets enhance decision-making processes and overall efficiency in data handling.
Key Components and Structure
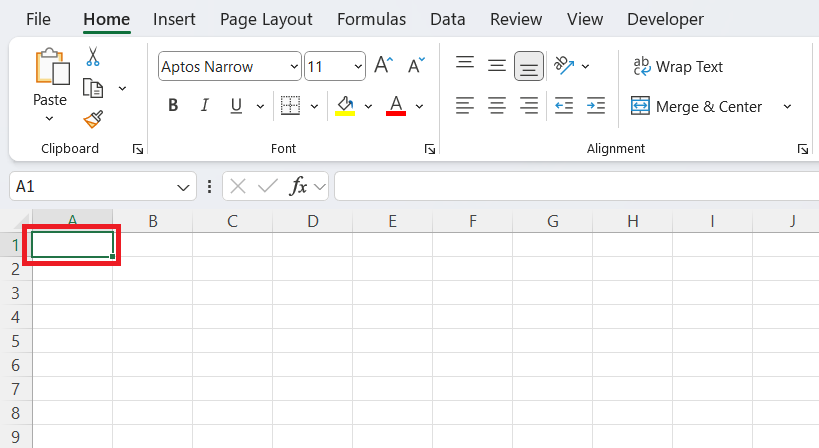
Excel spreadsheets are structured around several core components that aid in data organization and manipulation. The most basic element is the Cell, where data is entered; this is the intersection of a row and a column. Each cell has a unique Cell Reference, denoting its location with a letter (column) and a number (row).
The Active Cell refers to the visible, currently selected cell, highlighted by a green border.
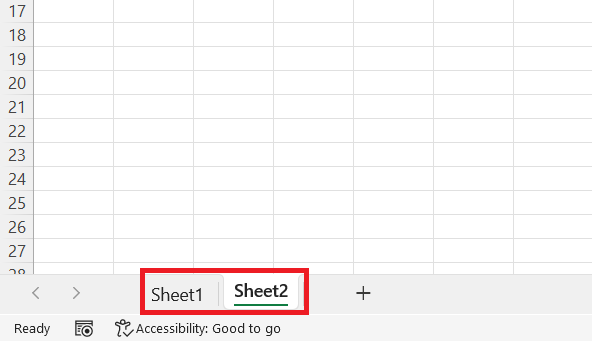
The entire Excel file is termed as a Workbook, which can contain multiple Worksheets or tabs like individual pages in a book. Navigation through these is facilitated by Worksheet Tabs located at the bottom left of the window.
Rows and columns are defined by Column and Row Headings, allowing for easy reference and traversal.
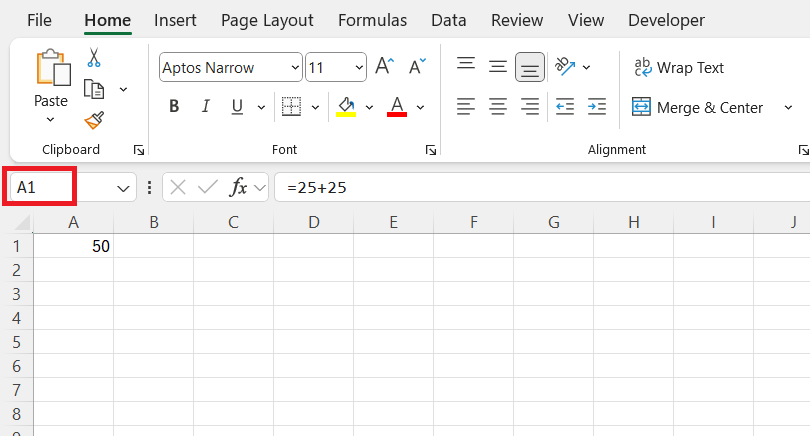
At the heart of Excel’s computational power are Formulas, which start with an equal sign and perform calculations or operations based on data within cells. The Formula Bar, situated at the top, is where users can input or edit these calculations.
To aid navigation, the Address Bar displays the coordinates of the active cell.
Together, these components create a cohesive structure that makes Excel an indispensable tool for managing and analyzing data efficiently.
Navigating the Excel Interface
Toolbars and Menu Navigation
The Excel interface is designed with an intuitive system of toolbars and menus that streamline navigation and enhance functionality. At the top of the screen, users will find the Ribbon, a set of tabs such as Home, Insert, Page Layout, Formulas, Data, Review, and View. Each tab is an organizational anchor for specific tools and commands relating to its function, from basic formatting to complex data manipulation.
The Quick Access Toolbar, typically situated above the Ribbon, offers customizable shortcuts for frequently used commands, like Save, Undo, and Redo. This toolbox is essential for enhancing workflow efficiency, as it allows rapid access to crucial functions without navigating through the Ribbon.
Within each tab, Command Groups categorize tools according to their use. For instance, in the “Home” tab, users will find groups such as Clipboard, Font, Alignment, and Number, offering commands for editing and formatting cell contents.
The File Menu, accessed via the top left, gives access to options for file management like creating, saving, and printing documents.
For browsing through Excel’s more complex functionalities, the Help feature offers guidance and tutorials, ensuring that users can effectively leverage Excel’s capabilities.
The seamless integration of these toolbars and menus helps both beginners and seasoned users navigate the application efficiently, supporting an array of tasks from simple to sophisticated data projects.
Sheet Tabs and Workbook Management
In Excel, managing multiple worksheets within a workbook is crucial for organizing and accessing data efficiently. At the bottom of an Excel window, you’ll find Sheet Tabs, which represent each worksheet in your workbook. These tabs allow you to switch between different sheets with ease, facilitating organization and separation of various datasets or tasks within a single file.
You can customize these sheet tabs by right-clicking to rename them, making it easier to understand the content of each sheet.
Additionally, you can color-code the tabs for quick visual identification, helping to distinguish between different categories or projects effortlessly.
The Workbook acts as the container for your worksheets. When opening Excel, you’re typically starting with a new workbook with default worksheets. You can add more sheets by clicking the “+” icon next to existing tabs.
Multiple sheets in a workbook enable a structured approach to large projects or complex data analysis without cluttering a single sheet with excessive information.
Management options through the right-click menu on the sheet tab also include the ability to move or copy sheets within the same workbook or to others, making it simple to organize data as needed. By leveraging these management tools, users can efficiently structure their workbooks to enhance their productivity and focus on data tasks without the confusion that comes with disorganized files.
Core Functions and Features
Basic Formulas and Calculations
Excel’s prowess lies in its ability to perform a variety of calculations using basic formulas. At the core of this capability is the ability to enter expressions that compute results based on the data present in the worksheet. Formulas in Excel always begin with an equals sign (=), followed by elements like functions, references to cells, and arithmetic operators.
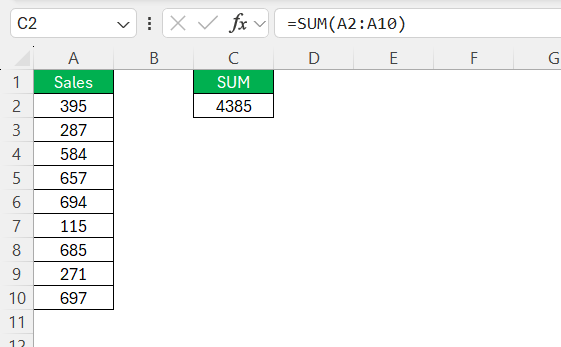
One of the simplest operations is SUM(), which adds up numbers in a specified range of cells. For example, =SUM(A2:A10) would provide the total of all numbers from cells A2 through A10. This function is invaluable for quickly computing totals and is frequently used in financial assessments or inventory summaries.
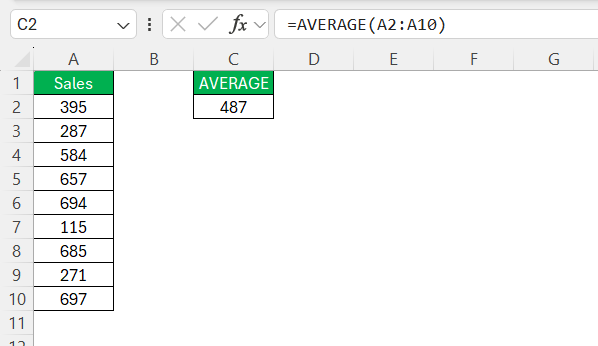
Another commonly used function is AVERAGE(), which calculates the mean of a set of numbers. For instance, =AVERAGE(A2:A10) it would yield the average value of the numbers in cells A2 through A10. This is particularly useful in academic settings or performance evaluations where understanding the central tendency of data is crucial.
Excel also supports more diverse operations through IF() functions, enabling conditional logic. An expression such as =IF(A2>500, "Above Target", "Below Target") helps categorize data points based on specified criteria, enabling more detailed data insights.
Furthermore, Excel allows for the use of cell references in formulas. These references can be relative (e.g., A1), absolute (e.g., $A$1), or mixed (e.g., A$1 for row-wise absolute). Understanding these references is essential for creating dynamic formulas that adapt when copied across cells, thereby maintaining their validity and integrity.
By mastering these basic formulas and calculation techniques, Excel users can significantly enhance their data processing capabilities, allowing for more comprehensive analysis and reporting across various scenarios.
Practical Applications of Spreadsheets
Everyday Use Cases
Excel spreadsheets assist in numerous everyday scenarios by simplifying tasks and improving efficiency. One of the most common uses is personal budget management. Individuals can track their expenses and income using simple spreadsheets, allowing them to visualize their financial health and plan accordingly. Excel’s ability to compile data into summary reports or charts further assists in making informed decisions about savings and expenditures.
For students, Excel serves as a valuable tool for keeping track of academic performance. With basic data entry and calculation formulas, students can input grades and assignments to monitor progress over time. Teachers, meanwhile, can use the same functionalities to maintain comprehensive grade books, which automatically calculate averages and track student attendance.
Planning and scheduling are also greatly enhanced with Excel. Families and professionals alike use spreadsheets to create calendars and organize events, utilizing features like conditional formatting to highlight important dates or deadlines. Lists, such as to-do lists or inventories, further benefit from Excel’s sorting and filtering capabilities, making task management straightforward.
In small business contexts, inventory tracking is a crucial application. Excel can store detailed records of stock, enabling automatic updating of quantities as products are sold or received. This approach helps businesses minimize losses due to overstocking or shortages.
Every day, spreadsheet use in Excel, therefore, dramatically enhances personal and professional productivity, offering versatile solutions to organizeand analyze various types of data efficiently. Whether it’s managing finances, academics, or daily schedules, Excel’s functionalities cater to a wide array of routine tasks, streamlining operations with precision and ease.
Advanced Applications in Business
In the business realm, Excel’s capabilities extend far beyond basic computations, offering sophisticated tools for advanced data analysis and decision-making processes. One primary application is in financial modeling, where Excel is used to simulate a company’s financial performance. By utilizing functions such as NPV (Net Present Value) or IRR (Internal Rate of Return), financial analysts can predict cash flows and assess the viability of investment projects.
Businesses also rely heavily on Excel for data analysis and visualization. Features like PivotTables allow users to organize and summarize large datasets, providing insights into sales trends or customer demographics. Coupled with graphical tools such as charts and graphs, companies can visually represent data for presentations and reporting, aiding in strategic planning and communication.
In supply chain management, Excel facilitates inventory assessments and forecasting. By inputting historical data and applying trend analysis, businesses can predict future demand, helping to optimize stock levels and enhance operational efficiency. Excel’s robust data filtering and sorting capabilities ensure swift and accurate access to critical information.
Another advanced business application is project management, where Excel serves as a platform for timeline tracking, resource allocation, and task scheduling. Customizable templates and Gantt charts provide a visual overview of project stages, deadlines, and dependencies, enabling teams to collaborate effectively and stay aligned with project goals.
Finally, Excel’s integration with other software through Dynamic Data Exchange (DDE) and Object Linking and Embedding (OLE) facilitates seamless data sharing across platforms, ensuring businesses can communicate and consolidate information from various applications efficiently. These advanced applications demonstrate Excel’s indispensable role in supporting business intelligence and operational strategies, enhancing productivity and informed decision-making.
FAQs
How do I create an Excel spreadsheet?
To create an Excel spreadsheet, open Microsoft Excel and click on “Blank Workbook” to start with a new sheet. You can begin entering data immediately into the default “Sheet1” or add more sheets as needed using the “+” icon at the bottom. Save your work by selecting “File” and “Save As” to choose your desired location and file name.
What is the main purpose of a spreadsheet in Excel?
A spreadsheet helps organize, calculate, and analyze data efficiently. It enables users to input data, apply formulas, and generate reports for decision-making.
What are some essential components of an Excel spreadsheet?
Key components include cells, cell references, sheet tabs, the Ribbon, and formulas. These elements work together to structure data and perform calculations.
How does the Ribbon improve navigation in Excel?
The Ribbon organizes tools into tabs and command groups, making it easier to access features like formatting, formulas, and data analysis. It enhances user efficiency by categorizing Excel’s functions.
What is the difference between a workbook and a spreadsheet?
A workbook is an entire Excel file that contains multiple spreadsheets, also called worksheets. A spreadsheet refers to a single sheet within the workbook where data is entered, organized, and analyzed. Workbooks help manage multiple related spreadsheets in one file.
John Michaloudis is a former accountant and finance analyst at General Electric, a Microsoft MVP since 2020, an Amazon #1 bestselling author of 4 Microsoft Excel books and teacher of Microsoft Excel & Office over at his flagship MyExcelOnline Academy Online Course.

