Many payroll teams, HR departments, and employees need to know how many biweekly pay periods occur in a given year. This is especially important for budgeting, payroll forecasting, and managing benefits. While it may seem like a fixed number, the answer can depend on the year and the start date of the pay cycle. Excel makes it easy to calculate the exact number of pay periods using simple formulas or dynamic date lists.
Key Takeaways
- A biweekly pay schedule typically results in 26 pay periods per year, but some years may have 27.
- Excel can calculate the number of pay periods by dividing the year length by 14 days.
- Formulas like
=INT((EndDate-StartDate)/14)+1can automatically calculate the number of periods. - Dynamic date lists help visualize each pay period throughout the year.
- Advanced methods using Power Query or VBA can automate payroll schedule creation.
Table of Contents
What Does Biweekly Mean in Payroll?
A biweekly schedule means employees are paid every 14 days. Since a year has 365 days, dividing by 14 gives approximately 26 pay periods. However, because 26 x 14 = 364, there is sometimes an extra pay period in years where the pay cycle overlaps into a 27th period. Knowing whether a year has 26 or 27 periods helps companies manage payroll expenses and employee expectations.
Step-by-Step: Calculating Biweekly Pay Periods in Excel
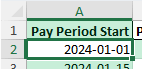
Step 1: Define Start and End Dates
Enter the start of the year into Excel:
Step 2: Generate Pay Period Dates
To generate a full list of pay periods, type your start date (e.g., 01-Jan-2024) in cell A2, then in A3 enter:
=A2+14

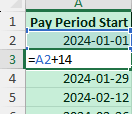
Drag this formula down to create a list of pay period start dates.
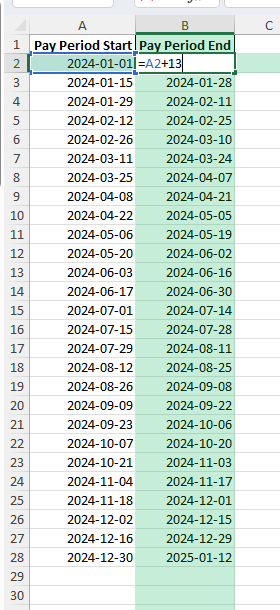
Add 13 to each start date to calculate the end of each period.
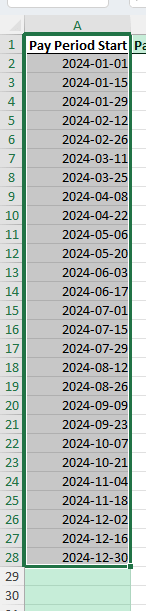
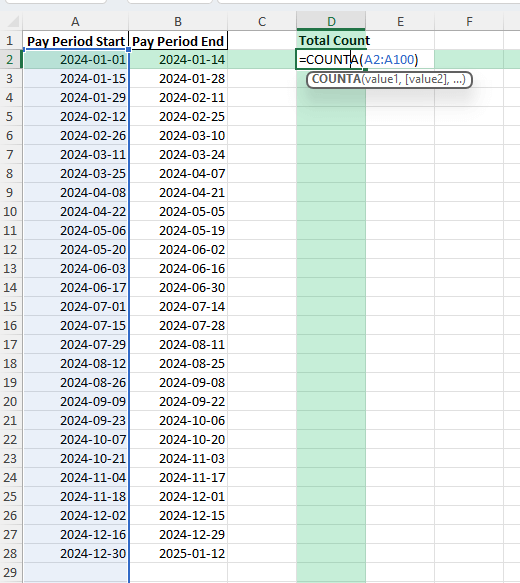
Step 3: Validate the Total Count
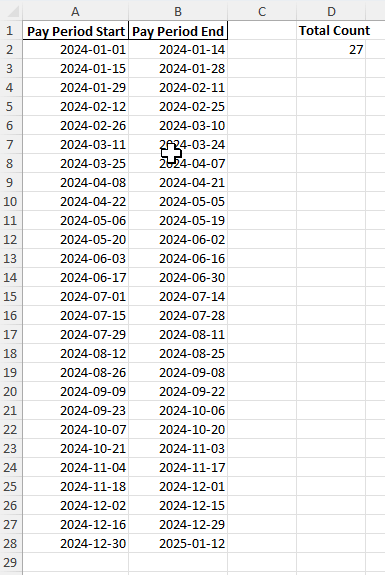
At the bottom of your list, use =COUNTA(A2:A100) to confirm the total number of periods.
For 2024, Excel will display 27 pay periods depending on your start date.
Common Mistakes and How to Fix Them
Using months instead of days: Biweekly means every 14 days, not twice per month. Avoid using monthly logic.
Forgetting leap years: Leap years may push schedules into an extra period if the start date aligns with certain days.
Incorrect cell references: Ensure formulas reference correct start and end date cells.
Not rounding correctly: Use INT or ROUNDUP to avoid fractional pay periods.
Bonus Tips and Advanced Scenarios
Highlight Paydays: Use conditional formatting to mark pay period start or end dates in your calendar.
Power Query: Automate the creation of biweekly pay schedules by generating lists of dates directly in Power Query.
VBA Automation: Use a macro to fill down pay period start and end dates:
Sub GenerateBiweeklyPeriods()
    Dim startDate As Date, endDate As Date, i As Integer
    startDate = Range("A2").Value
    endDate = Range("B2").Value
    i = 2
    Do While startDate <= endDate
        Cells(i, 3).Value = startDate
        Cells(i, 4).Value = startDate + 13
        startDate = startDate + 14
        i = i + 1
    Loop
End Sub
Budgeting: Link pay periods to payroll expenses to forecast cash flow accurately.
Cross-Year Calculations: Extend formulas to handle schedules that begin mid-year and roll into the next year.
Use Cases for Calculating Biweekly Pay Periods
Calculating the number of biweekly pay periods in a year is more than just a payroll exercise. It helps businesses, employees, and financial planners ensure accuracy, prevent errors, and improve planning. Below are five detailed scenarios where Excel’s calculation methods provide real value.
1) Payroll Management
Context: Payroll teams must ensure employees are paid accurately and on time. Whether a year has 26 or 27 pay periods affects salary distribution and total payments.
How to use in Excel:
Generate a list of pay period start and end dates using formulas like =A2+14 for rolling biweekly intervals.
Use =INT((EndDate-StartDate)/14)+1 to automatically count total pay periods.
Highlight actual pay dates in a calendar format using conditional formatting.
Benefits:
Prevents errors in payroll processing, especially in years with 27 periods.
Ensures accurate salary distribution across the entire workforce.
Reduces administrative rework by confirming the pay schedule early in the year.
2) Budget Forecasting
Context: Employers and finance departments need to budget salary expenses for the entire year. An extra pay period can significantly increase payroll costs.
How to use in Excel:
Link calculated pay periods to salary cost formulas, e.g., =PayPeriods*AverageSalary.
Create dashboards with PivotTables that show salary projections by month or quarter.
Add sensitivity analysis by testing both 26 and 27 pay period scenarios.
Benefits:
Improves cash flow management by predicting when payroll costs will spike.
Helps finance teams avoid budget shortfalls in years with 27 periods.
Supports long-term planning by aligning payroll with revenue forecasts.
3) Employee Communication
Context: Employees often want clarity on when they will be paid. A clear payroll calendar prevents confusion, especially when there is an additional paycheck in the year.
How to use in Excel:
Generate a list of pay dates using formulas and convert it into a calendar-style layout.
Share the Excel file or export it to PDF for easy distribution to staff.
Use color coding to highlight bonus paydays or the first and last checks of the year.
Benefits:
Improves transparency between employer and employees.
Reduces payroll-related queries to HR departments.
Helps employees better prepare for their own financial commitments.
4) Financial Planning
Context: Knowing the number of biweekly pay periods is vital for employees who want to plan their household budgets. An extra paycheck can be used strategically for savings, debt reduction, or large expenses.
How to use in Excel:
Link pay period schedules to personal budgeting spreadsheets.
Use SUM functions to project total income per month or quarter.
Create a savings tracker that highlights “extra paycheck” months with conditional formatting.
Benefits:
Allows employees to plan ahead for major expenses like holidays or tuition payments.
Encourages better financial discipline by anticipating cash inflows.
Provides a clearer picture of annual income distribution.
5) Compliance
Context: Companies must maintain accurate payroll records for audits, labor law compliance, and tax reporting. A mismatch in the number of pay periods can create reporting errors.
How to use in Excel:
Maintain a year-long log of pay periods with start and end dates.
Use Excel formulas to validate that every pay date falls within the correct year.
Link payroll calendars to compliance checklists or audit reports.
Benefits:
Reduces the risk of fines or penalties due to payroll miscalculations.
Provides auditors with clear, accurate pay period documentation.
Ensures compliance with wage and hour laws by documenting pay frequency.
FAQ
How many biweekly pay periods are in a year?
Usually 26, but some years may have 27 depending on the calendar and start date.
Why does 2024 have 27 pay periods?
Because 2024 is a leap year and January 1 is a Monday, the schedule results in 27 periods.
Can Excel handle mid-year payroll starts?
Yes, simply adjust the start date in your formula.
How do I check if a year has 27 pay periods?
Generate a full list of pay periods in Excel and count the entries.
Does biweekly mean twice a month?
No, it specifically means every 14 days, which differs from semi-monthly schedules.

John Michaloudis is a former accountant and finance analyst at General Electric, a Microsoft MVP since 2020, an Amazon #1 bestselling author of 4 Microsoft Excel books and teacher of Microsoft Excel & Office over at his flagship MyExcelOnline Academy Online Course.


