By default, Excel displays gridlines across all worksheets to help users align data easily. However, there are times when you may want to hide these lines, such as when creating dashboards, professional reports, or printable forms. This tutorial explains how to create a blank worksheet with no lines in Excel and why it is useful.
Key Takeaways
- Gridlines are displayed by default but can be hidden in just a few steps.
- Turning off gridlines improves the look of dashboards and printable reports.
- You can hide gridlines using Excel’s Ribbon options, Page Layout settings, or VBA code.
- Conditional formatting and borders can replace gridlines for controlled styling.
- A downloadable workbook is included with step-by-step examples and VBA automation.
Table of Contents
Why Hide Gridlines in Excel?
Gridlines are helpful for data entry but may not be suitable for professional outputs. For example, financial reports, dashboards, and presentation-ready spreadsheets often look cleaner without lines. Removing them provides a polished, document-like appearance while still allowing you to organize information effectively with borders or custom formatting.
Step-by-Step: How to Create a Blank Worksheet with No Lines
Step 1: Open a New Worksheet
Start by opening Excel and creating a new worksheet. You will see the standard gridlines across all blank cells.
Step 2: Go to the View Tab
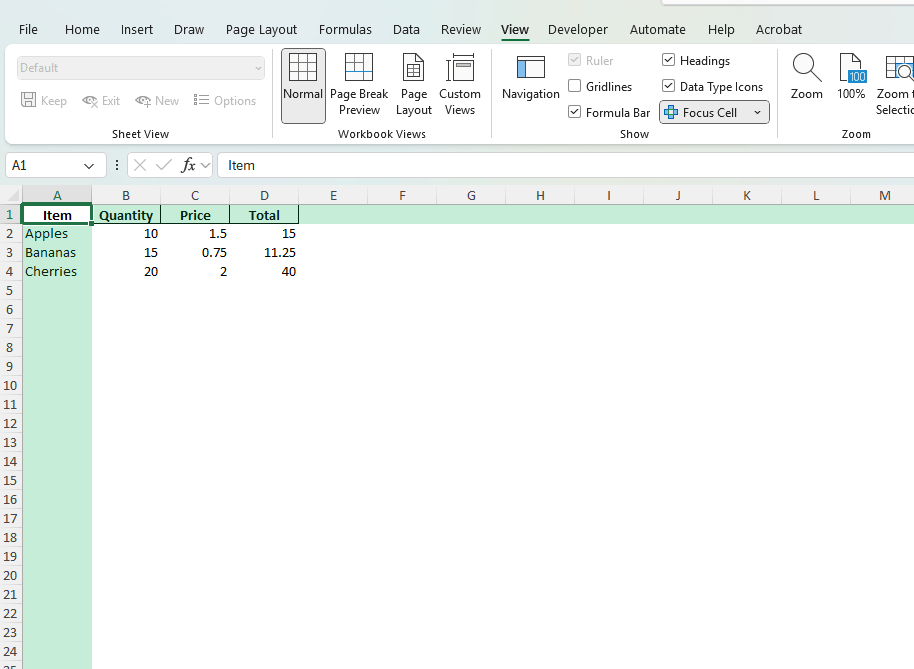
On the Ribbon, select the View tab. In the Show group, uncheck the option labeled Gridlines.
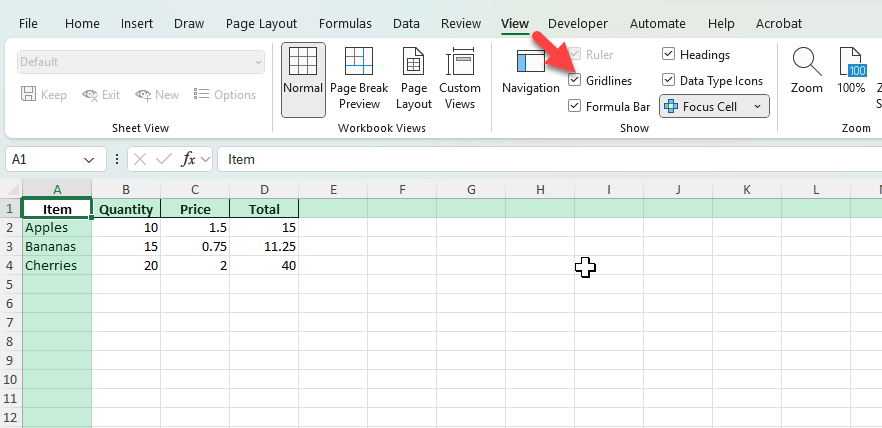
The lines will disappear immediately, leaving a blank worksheet surface.
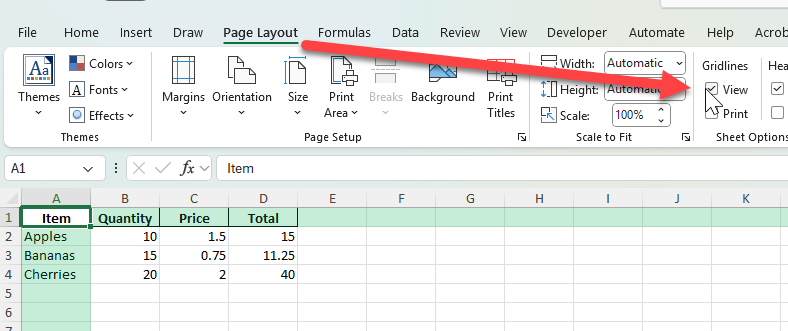
Step 3: Use the Page Layout Tab
Alternatively, go to the Page Layout tab. In the Sheet Options group, uncheck View under Gridlines. This option works the same way as in the View tab.
Common Mistakes and How to Fix Them
Gridlines vs. Borders: Gridlines are Excel’s default cell guides, while borders are user-defined. Do not confuse the two when formatting reports.
Hidden Only for One Sheet: Turning off gridlines applies only to the active worksheet. Repeat the steps for other sheets if needed.
White Background Issue: If the cell fill color is white, gridlines may appear hidden even if gridlines are still enabled. Check fill color settings.
Printing: Gridlines may not print by default. If you need lines in printed output, use borders instead of gridlines.
Bonus Tips and Advanced Scenarios
Use VBA to Toggle Gridlines: Add this macro to quickly hide or show gridlines:
Sub ToggleGridlines()
    With ActiveWindow
        .DisplayGridlines = Not .DisplayGridlines
    End With
End Sub
Create a Dashboard Layout: Hide gridlines, apply background colors, and use shapes or charts to design a dashboard on a clean canvas.
Power Query Data Presentation: Import data using Power Query, then hide gridlines on the report sheet for a professional presentation.
Apply Custom Themes: Combine hidden gridlines with a custom theme to make your Excel reports visually consistent.
Use Tables Instead: Convert data into Excel Tables, which use distinct formatting and eliminate the need for gridlines.
Use Cases for a Blank Worksheet with No Lines
Hiding gridlines in Excel may seem like a small change, but it has a big impact on the clarity and professionalism of your work. Below are detailed scenarios showing how blank worksheets without lines can be applied across business, education, and personal settings.
1) Business Reports and Financial Statements
Context: Company financial reports, profit and loss statements, or client presentations need to look professional and easy to read. Default gridlines can distract from the numbers and reduce the polished appearance expected in formal reports.
How to use in Excel:
Hide gridlines in the worksheet using the View tab options.
Add cell borders only around important data areas like totals or key financial sections.
Apply custom formatting such as bold headers and shaded backgrounds for separation instead of relying on gridlines.
Benefits: The report looks like a professional document rather than a raw spreadsheet, which makes it more suitable for executives, clients, and board members.
2) Dashboards and Visual Presentations
Context: Modern Excel dashboards rely heavily on charts, shapes, and conditional formatting. Gridlines often make dashboards look cluttered and unpolished.
How to use in Excel:
Hide gridlines on the dashboard sheet to create a clean canvas.
Insert charts, icons, and slicers without the distraction of cell lines in the background.
Use rectangles, shapes, and background colors to divide sections clearly while keeping the layout visually engaging.
Benefits: Stakeholders focus on visuals and KPIs instead of background lines, improving comprehension and overall design quality.
3) Printable Forms and Surveys
Context: Businesses and organizations often design forms in Excel for data collection, surveys, or checklists. Gridlines make these forms look like raw worksheets instead of structured documents.
How to use in Excel:
Turn off gridlines to make the form look cleaner when printed or shared as a PDF.
Apply borders selectively around input areas (like text boxes or numeric fields) where responses should be entered.
Combine hidden gridlines with shading or instructions to guide users on where to type their answers.
Benefits: The finished form looks like a professional template rather than a spreadsheet, which increases usability and user confidence in filling it out.
4) Training Materials and Student Worksheets
Context: Teachers and trainers frequently use Excel for exercises, practice assignments, and demonstrations. Too many gridlines can overwhelm learners, especially beginners who only need to focus on the key content.
How to use in Excel:
Hide gridlines before distributing training materials so students focus only on the relevant cells.
Apply borders and highlighting to specific problem areas or answer boxes.
Use formatting like bold text and shaded headers to separate sections of exercises.
Benefits: Learners engage with a simplified interface, making it easier to complete exercises without being distracted by unnecessary background lines.
5) Personal Planning and Productivity Tools
Context: Many individuals use Excel for personal planning, such as creating calendars, to-do lists, or weekly planners. Gridlines often clash with custom layouts and make planners harder to read.
How to use in Excel:
Hide gridlines to give the worksheet a clean, blank page appearance.
Manually add borders around calendar cells, weekly sections, or task lists for clarity.
Apply conditional formatting to highlight upcoming deadlines, completed tasks, or important dates.
Benefits: Your planner looks visually neat, easy to follow, and more like a designed template rather than a raw spreadsheet. It makes everyday planning tasks more pleasant and practical.
FAQ
Can I hide gridlines for just part of the sheet?
No, gridlines are either on or off for the entire worksheet, but you can use fill colors to hide them in specific areas.
Do hidden gridlines affect printing?
By default, gridlines do not print. Use borders if you want printed lines.
Will formulas still work without gridlines?
Yes, removing gridlines only affects visual appearance. Formulas and calculations are unaffected.
Can I set Excel to always start with no gridlines?
You can save a template with gridlines turned off and use it for new workbooks.
What if I only want borders in some places?
Apply borders manually using the Borders tool in the Ribbon to highlight only the cells you want outlined.

John Michaloudis is a former accountant and finance analyst at General Electric, a Microsoft MVP since 2020, an Amazon #1 bestselling author of 4 Microsoft Excel books and teacher of Microsoft Excel & Office over at his flagship MyExcelOnline Academy Online Course.


