When working with data in Excel, standard deviation is one of the most frequently used statistical measures. A common question among users is can standard deviation be negative in Excel? The short answer is no. Standard deviation is a measure of spread and is always a positive value or zero. This guide explains why, shows how to calculate it in Excel, and walks through practical examples and troubleshooting tips.
Key Takeaways
- Standard deviation measures the spread of values around the mean.
- It is always non-negative. The lowest possible value is zero when all data points are identical.
- Excel provides multiple functions for standard deviation:
STDEV.S,STDEV.P, and newer versionsSTDEVPAandSTDEVA. - A negative result in Excel usually indicates a formula or reference error, not a valid calculation.
- Sample data and formulas are included in a downloadable workbook.
Table of Contents
Can Standard Deviation be Negative?
Standard deviation is a statistical measure that describes how spread out values are from the average. If all numbers in a dataset are close to the mean, the standard deviation is low. If the numbers are spread widely, the standard deviation is higher. By definition, standard deviation is the square root of variance, which means it cannot be negative.
Step-by-Step: Calculating Standard Deviation in Excel
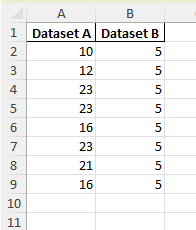
Step 1: Input Your Data
Enter your dataset in an Excel column. For example:
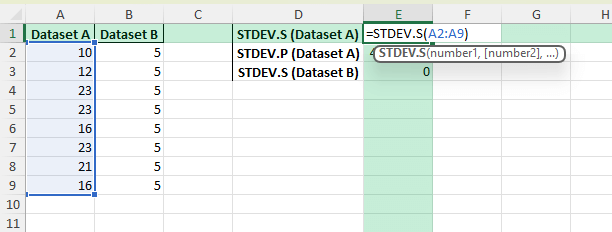
Step 2: Use the STDEV.S Function
For a sample dataset, type:
=STDEV.S(A2:A9)This calculates the sample standard deviation.
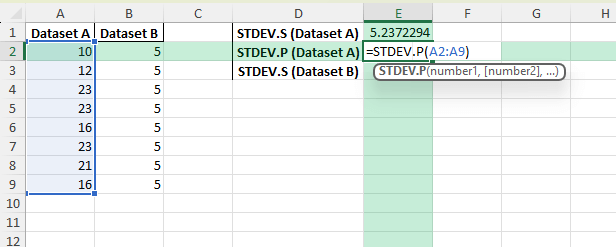
Step 3: Use the STDEV.P Function
If your data represents the entire population, use:
=STDEV.P(A2:A9)

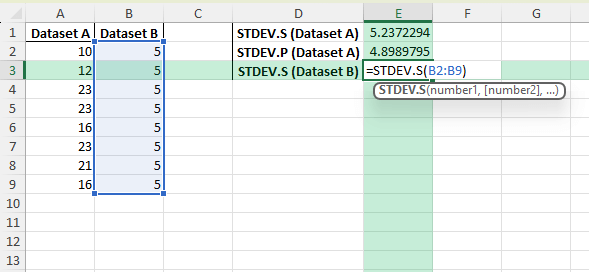
Step 4: Check for Zero Variance
If all numbers are the same, such as 5, 5, 5, 5, 5, Excel returns 0. This indicates no spread, which makes sense since every value is identical.
Common Mistakes and How to Fix Them
Expecting a negative result: Standard deviation is never negative. If you see a negative number, it may come from subtracting standard deviations instead of calculating them.
Wrong function choice: Use STDEV.S for samples and STDEV.P for populations.
Incorrect cell references: Ensure your formula covers the correct range. Misreferencing empty or wrong cells leads to incorrect results.
Text values in the dataset: Non-numeric values can cause errors. Use STDEVA if you want to include logical values.
Not handling missing values: Replace blanks with NA() or ensure only valid numbers are included.
Bonus Tips and Advanced Scenarios
Dynamic Ranges: Use Excel Tables so formulas automatically adjust when new data is added.
Power Query: Import large datasets into Excel, clean them, and calculate standard deviation automatically.
VBA Automation: Automate calculations with a macro:
Sub CalculateSTDEV()
    Dim ws As Worksheet
    For Each ws In ThisWorkbook.Sheets
        If ws.Name <> "Summary" Then
            ws.Range("C2").Formula = "=STDEV.S(A2:A100)"
        End If
    Next ws
End Sub
Charts: Add error bars in charts using standard deviation for better data visualization.
Comparison: Use side-by-side STDEV results for multiple datasets to evaluate variability.
Use Cases for Standard Deviation in Excel
Quality Control: Measure process consistency in manufacturing.
Finance: Assess investment risk by analyzing variability in returns.
Education: Evaluate test score distributions across students.
Business Forecasting: Understand variability in sales or demand.
Research: Summarize experimental results and check for consistency.
FAQ
Can standard deviation be negative?
No. By definition, standard deviation is always positive or zero.
Why does Excel show zero for standard deviation?
Because all values in your dataset are identical, leaving no variability.
What is the difference between STDEV.S and STDEV.P?
STDEV.S is for a sample of data, STDEV.P is for the entire population.
What if I get an error in my formula?
Check for text or blank cells in the dataset, and ensure the correct function is used.
Can Excel calculate standard deviation across multiple sheets?
Yes, by using 3D references or automating with VBA.

John Michaloudis is a former accountant and finance analyst at General Electric, a Microsoft MVP since 2020, an Amazon #1 bestselling author of 4 Microsoft Excel books and teacher of Microsoft Excel & Office over at his flagship MyExcelOnline Academy Online Course.


