Free Practice Workbook
CORREL is a statistical function that is used to measure the relationship between two sets of numbers. It tells you whether two things move together, move in opposite directions, or have no link at all. In this article, you will learn how to use the CORREL function in Excel.
Key Takeaways:
- CORREL measures the relationship between two sets of numbers.
- The result of CORREL is always between -1 and 1.
- A positive result means both values tend to move in the same direction.
- A negative result means the values tend to move in opposite directions.
- CORREL only measures linear relationships between values.
Table of Contents
Introduction to the CORREL Function
Define Correlation
CORREL returns the correlation coefficient of two ranges. This number is also called the Pearson correlation coefficient. It shows how closely two sets of values follow a straight-line pattern.
The result of this correlation can range between -1 and 1.
- A result close to 1 means a strong positive relationship. When one value goes up, the other goes up too.
- A result close to -1 means a strong negative relationship. When one value goes up, the other goes down.
- A result close to 0 means there is little or no linear relationship.
Syntax of the CORREL function
=CORREL(array1, array2)
- array1 is the first range of values.
- array2 is the second range of values.
How to use the CORREL function
Step-by-Step Guide
In this example, you will be using the CORREL function to understand the relationship between the amount spent on advertising and the sales amount.
STEP 1: Select the cell where you want to display the correlation result.
STEP 2: Enter the CORREL function.
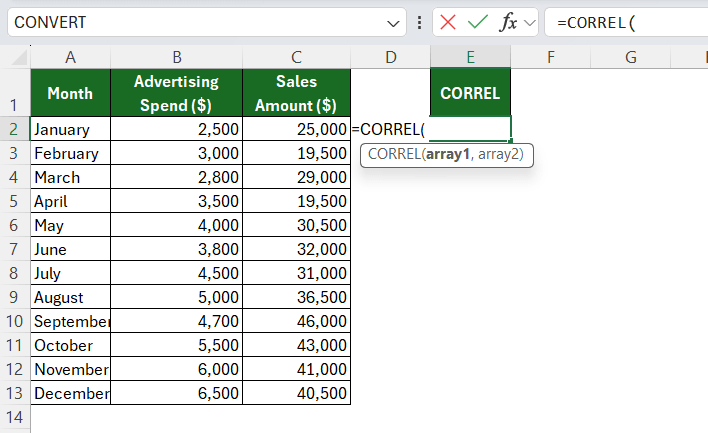
STEP 3: Select the range containing the advertising amount
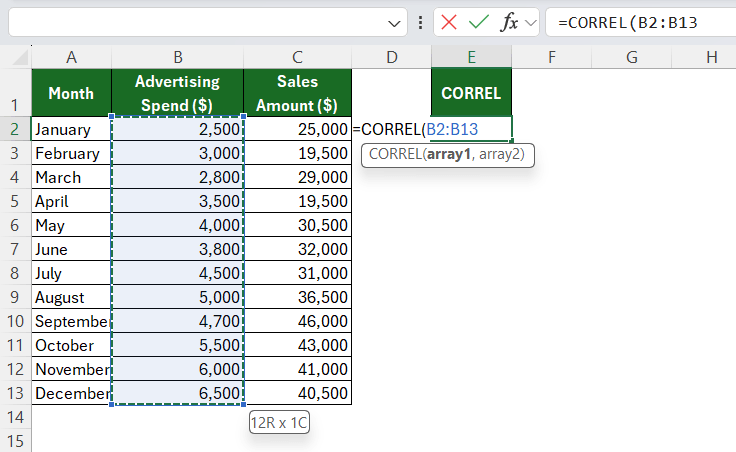
STEP 4: Select the range containing the sales amount.
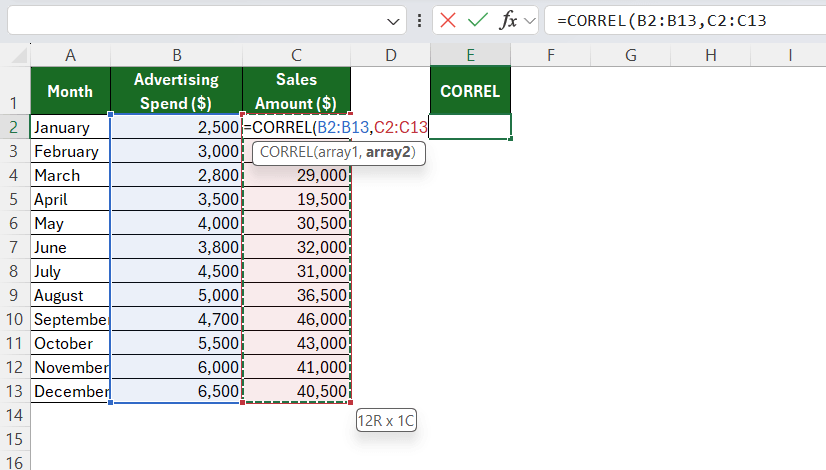
STEP 5: Close the parentheses and press Enter to calculate the correlation.
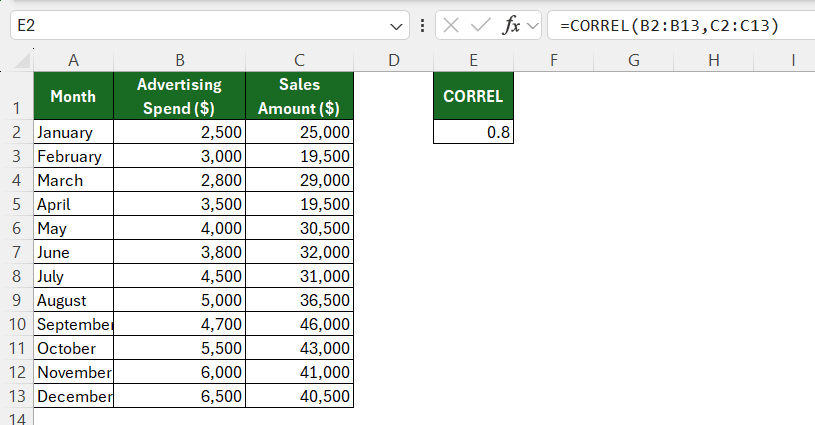
This means there is a strong positive correlation between advertising and sales.
When to Use the CORREL Function
The CORREL function can be useful when you want to find patterns in numerical data.
You can use it to compare sales with advertising expenses, product prices with demand, or study hours with exam scores.
Common CORREL Function Errors
#N/A Error
Excel may return a #N/A error when the two arrays contain different numbers of data points.
Check both ranges and make sure they have the same size.
#DIV/0! Error
Excel may return a #DIV/0! error when there is not enough numeric data or when one of the data sets has no variation.
For example, if every value in one range is 10, Excel cannot calculate a meaningful correlation.
Numbers stored as text
CORREL ignores text. A number typed with a leading apostrophe or imported as text is skipped.
CORREL Does Not Mean Causation
A strong correlation does not always mean that one value causes the other value to change.
For example, ice cream sales and electricity usage may both increase during summer. This does not mean that higher ice cream sales cause higher electricity usage. Hot weather can be the reason both values increase.
FAQs
What does the CORREL function do in Excel?
It measures the relationship between two sets of numerical values.
What does a CORREL result of 1 mean?
If the result of the CORREL function is 1, it means there is a perfect positive correlation between the two data sets.
What does a negative correlation result mean?
Negative correlation means the two variables are moving in opposite directions.
Can CORREL return a value greater than 1?
No, correlation cannot return a value greater than 1. The result is always between -1 and 1.
Are CORREL and PEARSON the same in Excel?
They both calculate the Pearson correlation coefficient and normally return the same result.

John Michaloudis is a former accountant and finance analyst at General Electric, a Microsoft MVP since 2020, an Amazon #1 bestselling author of 4 Microsoft Excel books and teacher of Microsoft Excel & Office over at his flagship MyExcelOnline Academy Online Course.

 30 Days - Full Access