Pinterest Pixel

The Ultimate Guide to Cumulative Relative Frequency in Excel

John Michaloudis
Cumulative relative frequency is useful in tracking trends, distributions, and the accumulation of data over a range.
It tells you the proportion of each data point relative to the total.

In this article, you will learn how to calculate cumulative relative distribution in Excel.

What is Cumulative Relative Frequency?

Cumulative Relative Frequency represents the proportion of data that falls above or below a specific value. It is calculated by dividing the cumulative frequency by the total number of observations. Cumulative relative frequency starts from a small value, gradually increases, and reaches 1 for the last observation.

It is used to understand the distribution of the data, identify outliers, and make smart decisions.


How to Calculate Cumulative Relative Frequencies

Preparing Your Dataset

The first step is to create a data table. It will have two separate columns for individual data categories and frequency of occurrence for each category.

Cumulative Relative Frequency in Excel

Use the Remove Duplicate option to make sure that there are no duplicates in the category column.

Cumulative Relative Frequency in Excel

Cumulative Frequency Table

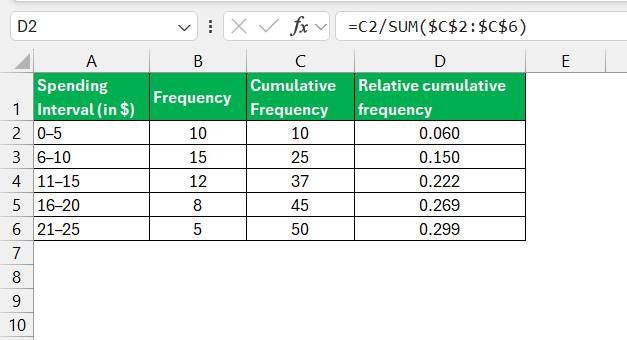
Once your data is in place, crafting a cumulative frequency table is quite straightforward. First, insert an additional column in your Excel spreadsheet next to the frequency column and title it “Cumulative Frequency”.

Cumulative Relative Frequency in Excel

Start from the top of this new column; for the first row, the cumulative frequency equals the frequency.

Cumulative Relative Frequency in Excel

For subsequent rows, it’s the sum of the previous cumulative frequency and the current frequency. To make things even simpler, you can use Excel’s SUM function—just be mindful to adjust the range appropriately as you go down the rows.

Cumulative Relative Frequency in Excel

After tallying all the cumulative frequencies, you might choose to add a column for Relative cumulative frequency, where each cumulative frequency is divided by the total sum, converting it into a percentage if desired.

Cumulative Relative Frequency


Real-World Scenarios

The application of cumulative relative frequency extends into every domain where data is utilized to make important decisions. In educational settings, it can be used to track the progression of student grades over time. In the boardroom, this information can direct financial decision-making by showing the cumulative percentage of revenue achieved per week or month.

Supply chain analysts can forecast product demands, while public health officials can track disease incidence rates. The versatility of this tool is what makes it indispensable in real-life situations, allowing professionals to translate raw data into actionable intelligence.


Common Mistakes

One common misstep in working with cumulative frequencies in Excel is mistaking it for simple frequency or relative frequency. This error can lead to inaccurate information, as cumulative relative frequency looks at the aggregate effect over the data range. To avoid this, double-check your formulas and the range of cells included in the calculations.

Another pitfall is incorrect data range selection, which skews the cumulative total. Make sure that your cell references are absolute where needed, especially when copying formulas across multiple cells. Keeping vigilant about data entry and cleansing is also vital to avoid inaccuracies from the get-go.


FAQs

What is the cumulative relative frequency?

Cumulative relative frequency shows the accumulation of each data point relative to the whole.

How to find the cumulative relative frequency in Excel?

To find the cumulative relative frequency in Excel, follow the steps below:

  • Calculate the relative frequency for each data item.
  • Add the relative frequencies of all previous items to the current one’s relative frequency.

What are some common errors to watch out for when working with cumulative frequencies in Excel?

Some of the common errors include:

  • Incorrect range selection, which can lead to skewed results
  • Not using absolute references in formulas can cause errors when copying formulas down a column.

What is the relative frequency formula in Excel?

The relative frequency formula is the frequency of an occurrence divided by the total number of data points. If you have the frequency in cell B2 and the total number in cell B10, the formula in Excel would be:

=B2/B10

If you like this Excel tip, please share it


Founder & Chief Inspirational Officer

at

John Michaloudis is a former accountant and finance analyst at General Electric, a Microsoft MVP since 2020, an Amazon #1 bestselling author of 4 Microsoft Excel books and teacher of Microsoft Excel & Office over at his flagship MyExcelOnline Academy Online Course.

See also  How to use Power Function Tactics for Excel Spreadsheets

Star 30 Days - Full Access Star

One Dollar Trial

$1 Trial for 30 days!

Access for $1

Cancel Anytime

One Dollar Trial
  • Get FULL ACCESS to all our Excel & Office courses, bonuses, and support for just USD $1 today! Enjoy 30 days of learning and expert help.
  • You can CANCEL ANYTIME — no strings attached! Even if it’s on day 29, you won’t be charged again.
  • You'll get to keep all our downloadable Excel E-Books, Workbooks, Templates, and Cheat Sheets - yours to enjoy FOREVER!
  • Practice Workbooks
  • Certificates of Completion
  • 5 Amazing Bonuses
Satisfaction Guaranteed
Accepted paymend methods
Secure checkout

Get Video Training

Advance your Microsoft Excel & Office Skills with the MyExcelOnline Academy!

Dramatically Reduce Repetition, Stress, and Overtime!
Exponentially Increase Your Chances of a Promotion, Pay Raise or New Job!

Learn in as little as 5 minutes a day or on your schedule.

Learn More!

Share to...