Free Practice Workbook
Table of Contents
Introduction to Beta in Finance
What is Beta?
Beta is a measure of an asset’s sensitivity to market movements. It quantifies the relationship between the returns of an asset and the overall market.
Using Built-in Excel Functions for Beta
When I calculate beta, I primarily use two formulas: COVARIANCE.S and VAR.P.
β = Covariance(Asset Returns,Market Returns) / Variance(Market Returns)
- Covariance: Measures how the asset’s returns move with the market.
- Variance: Measures the spread of the market returns.
When I divide the covariance of the stock and market returns by the market’s variance, the result is beta. It is used to summarize the expected movement of a stock in relation to the market.
Step-by-Step Guide on Beta Formula in Excel
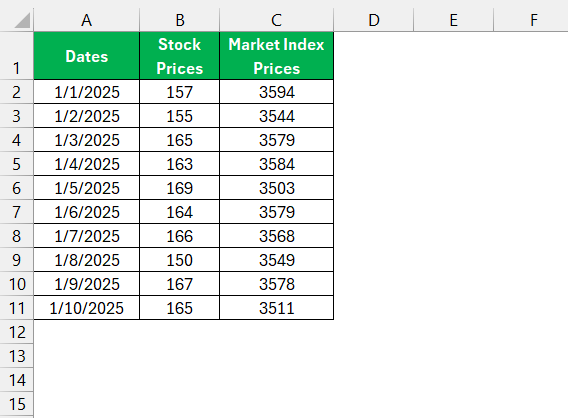
Collect the Data
The first thing I do is gather the necessary data:
- Dates
- Historical closing prices of the stock
- Historical closing prices of the market index
Calculate Returns
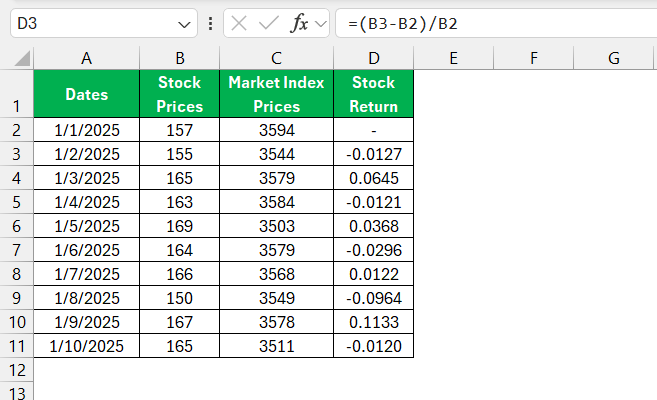
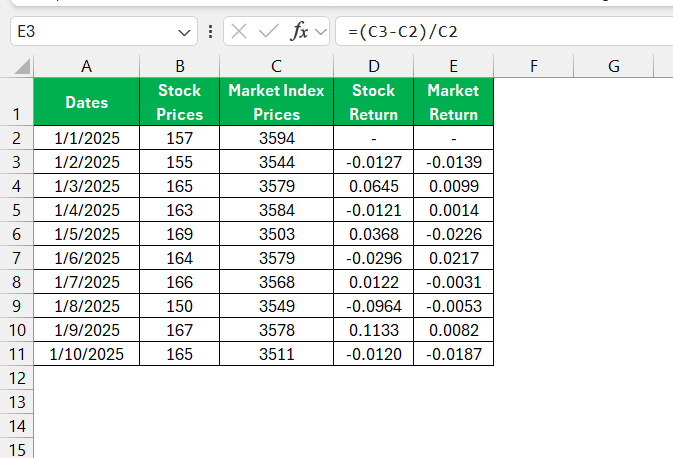
Use this formula to calculate daily or weekly returns:
Stock Return:
Market Return:
Use Excel Functions
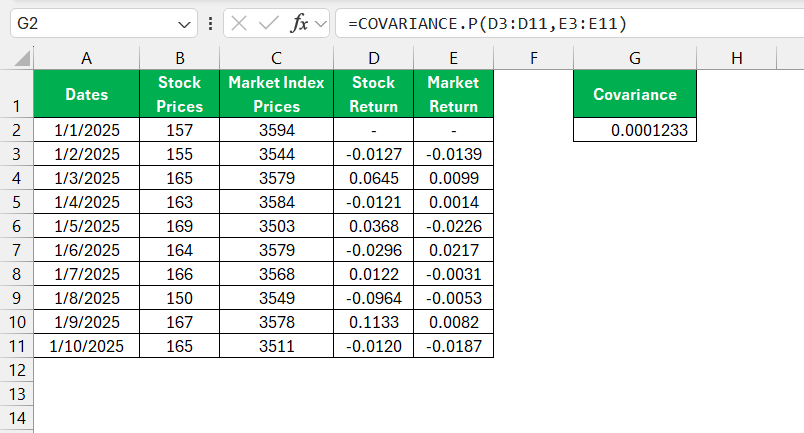
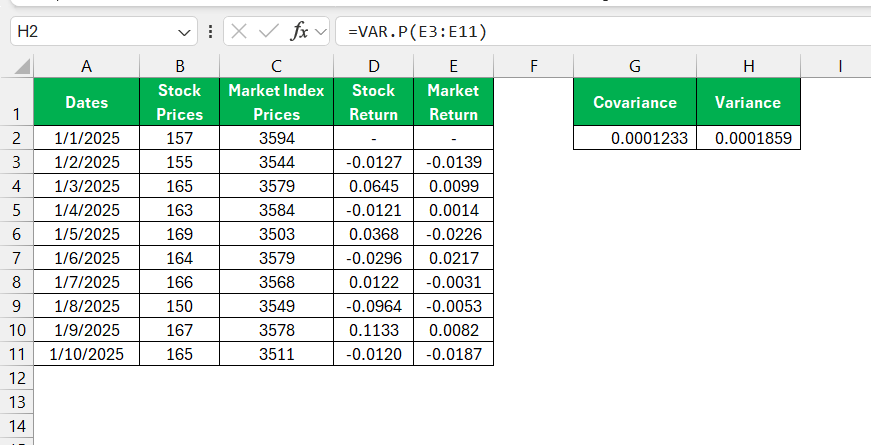
Use the COVARIANCE.P function for population covariance. For example, if stock returns are in column D and market returns are in column E:
=COVARIANCE.P(D3:D11, E3:E11)
Use the VAR.P function for population variance. For market returns in column E:
=VAR.P(E3:E11)
Calculate Beta
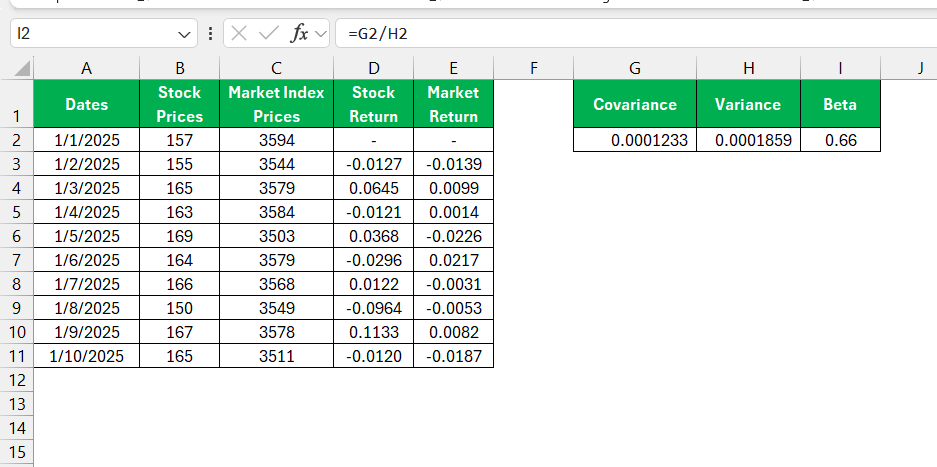
Finally, I calculate the beta by dividing the covariance by the variance:
=COVARIANCE.P(D3:D11, E3:E11) / VAR.P(E3:E11)
Interpret Results
What High and Low Beta Values Indicate
- Beta above 1: The stock is more volatile than the market. It tends to rise more in strong markets and fall more in weak markets. Suitable for investors seeking higher growth and willing to take on more risk.
- Beta below 1: The stock is less volatile than the market. It experiences smaller price swings and may offer greater stability. Suitable for conservative investors focused on preserving capital and achieving long-term goals.
Applying Beta for Investment Strategies
- Use high-beta stocks when expecting a strong market and aiming for higher returns.
- Use low-beta stocks during uncertain market conditions or when prioritizing stability.
- Mix high- and low-beta investments to balance risk and return in a portfolio.
- Use beta matching to help hedge investments or track the performance of a specific market index.
- Monitor beta regularly to ensure your portfolio aligns with your risk tolerance and investment goals.
Common Concerns
- Make sure the stock and market data use the same dates and time intervals.
- Check that each stock return matches the market return for the same period.
- Look for unusual spikes or drops that could affect the beta calculation.
- Adjust the data for dividends and stock splits for accurate results.
FAQs
1. What does a beta value of 1 mean?
A beta of 1 means the stock tends to move in line with the overall market.
2. Can I calculate beta in Excel without special tools?
Yes. You can use Excel functions such as COVARIANCE.P and VAR.P.
β = Covariance/ Variance
3. Why is beta important for investors?
Beta helps measure a stock’s risk compared to the market.
4. What does a negative beta indicate?
A negative beta means the stock tends to move in the opposite direction of the market.
5. How often should beta be updated?
Beta should be reviewed regularly using the latest market and stock data.

John Michaloudis is a former accountant and finance analyst at General Electric, a Microsoft MVP since 2020, an Amazon #1 bestselling author of 4 Microsoft Excel books and teacher of Microsoft Excel & Office over at his flagship MyExcelOnline Academy Online Course.

 30 Days - Full Access