Return on Investment (ROI) is one of the most widely used financial metrics. It measures the profitability of an investment by comparing the return relative to its cost. Whether you are evaluating a business project, marketing campaign, or personal investment, Excel provides simple and powerful ways to calculate ROI accurately. In this guide, we will explore formulas, examples, and practical applications.
Key Takeaways
- ROI measures profitability by comparing net gain to the original investment.
- The basic formula is
ROI = (Return – Investment) / Investment. - Excel can calculate ROI using direct formulas or helper columns for clarity.
- Formatting ROI as a percentage makes results easier to interpret.
- Advanced methods like Power Query or VBA can automate ROI tracking across multiple projects.
Table of Contents
What is ROI?
ROI (Return on Investment) is a performance measure that evaluates the efficiency of an investment. A positive ROI indicates profit, while a negative ROI signals a loss. Expressed as a percentage, ROI makes it easy to compare the profitability of different investments or projects.
Step-by-Step: How to Calculate Return on Investment in Excel
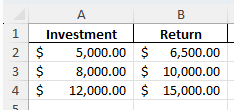
Step 1: Enter Your Data
Create a simple table with two columns: Investment and Return. For example:
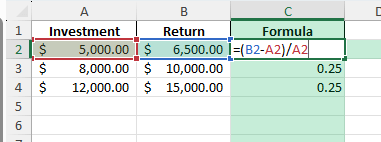
Step 2: Apply the ROI Formula
In a new column, type the formula:
=(B2-A2)/A2This calculates ROI by subtracting the investment cost from the return, then dividing by the investment cost.
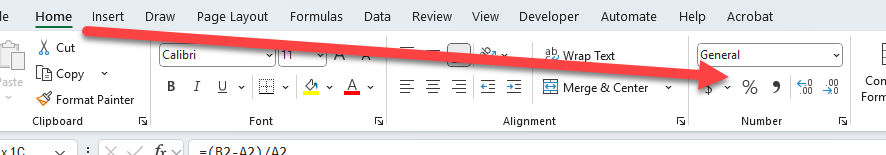
Step 3: Format as Percentage
Format the ROI results as percentages for easier interpretation. For example, 0.30 becomes 30%.
Step 4: Copy the Formula
Drag the fill handle down to copy the formula for all rows in your dataset.

Common Mistakes and How to Fix Them
Mixing absolute numbers with percentages: Always format ROI as a percentage to make it meaningful.
Incorrect order of operations: Ensure parentheses are used properly in formulas, especially when combining with other calculations.
Using total revenue instead of net return: Always subtract the initial investment from the return before dividing.
Not accounting for time: ROI does not consider the time value of money. Use IRR or NPV functions for time-based analysis.
Bonus Tips and Advanced Scenarios
Automating with Power Query: Import project data and create a query to calculate ROI for all investments dynamically.
Adding Conditional Formatting: Highlight positive ROI values in green and negative ones in red for quick insights.
Using VBA: Automate ROI calculation across multiple sheets with a simple macro:
Sub CalculateROI()
    Dim ws As Worksheet
    For Each ws In ThisWorkbook.Sheets
        If ws.Name <> "Summary" Then
            ws.Range("C2:C100").Formula = "=(B2-A2)/A2"
        End If
    Next ws
End Sub
Use Cases for ROI Calculations
ROI is a versatile metric that applies across industries and personal finance. Below are detailed examples showing how ROI can be applied in Excel for different contexts, along with practical steps and benefits.
1) Business Projects and Strategic Decisions
Context: Businesses often invest in product launches, facility expansions, or operational upgrades. Leaders need to know whether these initiatives generate enough financial return to justify the cost.
How to use in Excel:
Set up a table with columns for Investment Cost, Revenue/Return, and ROI Formula.
Use =(Return - Investment)/Investment to calculate ROI.
Build comparison tables for multiple projects to evaluate which ones generate the best returns.
Apply conditional formatting to highlight projects with ROI below 0% as red and those above company targets as green.
Benefits:
Supports decision-making for future investments by clearly identifying profitable initiatives.
Helps prioritize resources by comparing competing projects side by side.
Provides data-backed evidence for stakeholders and board presentations.
2) Marketing Campaign Evaluation
Context: Marketing budgets often include digital ads, print media, or promotional events. Measuring ROI ensures the money spent actually delivers measurable revenue or brand value.
How to use in Excel:
Track campaign costs (ad spend, production costs) in one column and revenue generated (sales or leads) in another.
Apply the ROI formula to calculate profitability for each campaign.
Use PivotTables to compare ROI by channel (e.g., Facebook, Google Ads, email marketing).
Create charts showing ROI trends across time to understand which strategies are most effective.
Benefits:
Helps managers allocate marketing budgets to the highest-performing campaigns.
Reveals underperforming channels that should be scaled back or improved.
Improves accountability by showing measurable results for marketing spend.
3) Investments and Financial Portfolio Tracking
Context: Investors need to evaluate returns on assets like stocks, bonds, ETFs, or mutual funds. ROI helps compare which assets deliver the best growth relative to their cost.
How to use in Excel:
Enter purchase cost, current value, and any dividends or interest earned for each investment.
Use ROI formula =(CurrentValue + Dividends - InitialCost)/InitialCost.
Extend with helper columns to track annualized ROI or compare multiple investments in a portfolio.
Build a dashboard that shows top-performing and underperforming assets at a glance.
Benefits:
Provides investors with clear, comparable metrics for different assets.
Helps in deciding whether to hold, buy more, or sell an investment.
Supports diversification strategies by highlighting imbalances in portfolio performance.
4) Education and Training Programs
Context: Companies often invest in employee training, certifications, or academic courses. ROI can be used to measure whether the cost of training results in higher productivity, reduced turnover, or improved revenue.
How to use in Excel:
Record training costs such as course fees, employee time, and travel expenses.
Track measurable outcomes like increased sales, faster project completion, or reduced errors.
Use ROI formulas to compare gains against costs, with helper columns for before-and-after performance metrics.
Create charts showing ROI for different training programs to guide HR and management decisions.
Benefits:
Provides evidence for whether training investments deliver measurable benefits.
Helps HR teams allocate budgets to the most impactful programs.
Supports employee development strategies with clear data on outcomes.
5) Personal Finance and Wealth Management
Context: Individuals can use ROI to evaluate the performance of personal financial decisions, such as buying property, investing in a business, or tracking savings accounts.
How to use in Excel:
List initial investments like down payments, renovation costs, or stock purchases.
Enter the returns such as property value increases, rental income, or dividends.
Apply ROI formulas to measure the overall percentage return for each decision.
Use Data Tables or What-If Analysis to see how ROI changes with different assumptions (e.g., higher rental income, lower property value growth).
Benefits:
Gives individuals insight into which financial choices are paying off.
Supports smarter planning for future investments like retirement savings or real estate purchases.
Encourages disciplined financial tracking and goal-setting with clear numbers.
FAQ
What is the formula for ROI in Excel?
ROI = (Return – Investment) / Investment
Should ROI always be shown as a percentage?
Yes, formatting ROI as a percentage makes it easier to interpret.
What if ROI is negative?
A negative ROI means the investment lost money relative to its cost.
How do I compare ROI across different projects?
Use percentages to compare profitability, but also consider duration and risk.
What Excel functions are alternatives to ROI?
Use IRR (Internal Rate of Return) or NPV (Net Present Value) for time-based and cash flow analysis.

John Michaloudis is a former accountant and finance analyst at General Electric, a Microsoft MVP since 2020, an Amazon #1 bestselling author of 4 Microsoft Excel books and teacher of Microsoft Excel & Office over at his flagship MyExcelOnline Academy Online Course.


