Counting how many Fridays occur in a year can be useful for payroll planning, event scheduling, or project timelines. Instead of manually checking a calendar, Excel can calculate this quickly using formulas. In this guide, we will look at several ways to count Fridays in a year, including formulas, Power Query, and VBA automation.
Key Takeaways
- The
WEEKDAYfunction can identify which day of the week a date falls on. SUMPRODUCTwithWEEKDAYcan count specific weekdays in a date range.- Fridays correspond to a weekday number of 6 when Sunday is considered day 1.
- VBA can loop through dates to count Fridays automatically.
- Power Query can also handle weekday counting for large datasets.
Table of Contents
Understanding the Friday Count
In Excel, the WEEKDAY function returns a number from 1 to 7 that represents the day of the week. By default, Sunday is 1 and Saturday is 7. Friday is represented by 6 in this numbering system. By iterating through the dates of a year and counting how many times the result is 6, you can find the total number of Fridays.
Excel’s date functions are powerful tools that can transform how you manage time-related data. By leveraging functions such as DATE, WEEKDAY, and NETWORKDAYS, you can easily organize, track, and analyze dates for various applications. For instance, the DATE function creates a date value from individual year, month, and day inputs. Meanwhile, WEEKDAY determines the day of the week, returning a numerical value for quick calculations. Familiarizing yourself with these functions can significantly enhance your ability to handle date-related data efficiently.
Practical Applications of Date Tracking
Understanding Excel’s date functions opens the door to numerous practical applications across various fields. For starters, you can use these functions to manage personal schedules by calculating the number of specific weekdays in a month or year, like Fridays. This method becomes particularly useful for event planning, ensuring consistent meeting schedules or monitoring deadlines.
In business, date tracking is crucial for financial reporting, helping you gauge working days for payroll or evaluate the time between invoicing and payment. Additionally, educators can design lesson plans by tracking school days against holidays. These applications show just how versatile and essential date tracking can be when managed correctly.
Furthermore, Excel enables dynamic calendar creation. By automating the process, you can update and enhance your calendar as required, accommodating changing schedules seamlessly. This capability extends to training sessions, workshops, or even vacation planning, offering a clear picture of available days for maximum productivity.
Another valuable application is calculating project timelines. Whether for construction or software development projects, knowing how many Fridays exist in a given period could affect resource allocation and team distribution.
Step-by-Step: Count Fridays in a Year Using Excel
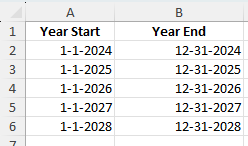
Enter your start and end dates: Create two columns with the first and last dates of the year.
Year Start   Year End
1/1/2024     12/31/2024
1/1/2025     12/31/2025
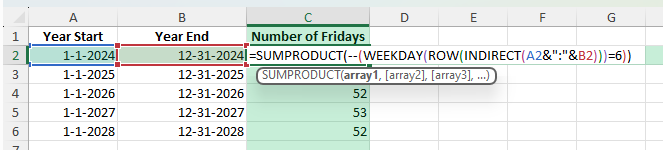
Apply the formula: In a new column, enter:
=SUMPRODUCT(--(WEEKDAY(ROW(INDIRECT(A2&":"&B2)))=6))
Where:
- A2 is the start date.
- B2 is the end date.
- 6 represents Friday in the default
WEEKDAYnumbering.
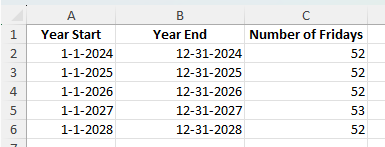
Format the result: Display the result as a number with no decimals.
Copy down: Apply the formula for each row to calculate the number of Fridays for each year.
Common Mistakes and How to Avoid Them
Wrong weekday numbering: Check your WEEKDAY function’s return type to ensure 6 corresponds to Friday.
Date format issues: Ensure the start and end dates are valid Excel dates, not text.
Incorrect range: Make sure your start and end dates cover the entire year.
Bonus Tips and Advanced Scenarios
Count Other Days: Replace 6 in the formula with another number to count different weekdays.
Power Query Method: Create a list of dates, add a weekday column, filter for Fridays, and count the rows.
VBA Macro Automation: Use VBA to loop through dates and count Fridays:
Sub CountFridays()
    Dim startDate As Date, endDate As Date
    Dim d As Date, countFri As Long

    startDate = Range("A2").Value
    endDate = Range("B2").Value
    countFri = 0

    For d = startDate To endDate
        If Weekday(d, vbMonday) = 5 Then ' Friday with Monday=1
            countFri = countFri + 1
        End If
    Next d

    Range("C2").Value = countFri
End Sub
Real-World Applications and Examples
Project Management and Scheduling
Incorporating Excel’s date functions into project management and scheduling can dramatically enhance the accuracy and efficiency of your time management. Excel offers versatile tools like Gantt charts and timeline tracking to assist with visual project planning. Start by listing key project milestones alongside their respective dates, then use conditional formatting to visually differentiate between task statuses.
A critical application is identifying project constraints by assessing available workdays, especially with the inclusion of weekends and holidays through the NETWORKDAYS function. This approach ensures that deadlines are realistic and that resources are allocated effectively.
In agile teams, where scheduling flexibility is essential, Excel allows for dynamic updates. As project specifics shift, you can readily adjust timelines, thus maintaining an agile approach to management. Regularly updating your schedule to reflect current progress helps keep all team members aligned and aware of milestones.
Moreover, non-profit organizations and community projects can benefit from these scheduling capabilities, ensuring that volunteer efforts are well-coordinated around available schedules. By leveraging Excel’s date functions, project managers can maintain clear oversight of timelines, enhance collaboration, and keep projects moving forward efficiently.
This integration of precise scheduling techniques ensures that projects are completed on time and within budget, optimizing both resources and outcomes.
Enhancing Business Insights with Date Analytics
Excel’s robust capabilities allow you to enhance your business insights through sophisticated date analytics. By employing date functions and pivot tables, you can uncover trends and patterns that might otherwise go unnoticed. For instance, analyzing sales data by date can reveal seasonal trends, helping you make informed inventory decisions.
Delve deeper by segmenting data using the WEEKDAY and MONTH functions to pinpoint peak periods or identify operational inefficiencies. This analysis supports strategic planning, such as adjusting staffing levels during high-demand times.
Additionally, advanced users can integrate Excel with business intelligence tools to combine date analytics with broader datasets, unveiling deeper insights across departments. Examples include tracking employee performance relative to workload fluctuations or measuring the impact of marketing campaigns on sales over specific periods.
To further leverage date analytics, consider incorporating predictive modeling. This enables anticipatory action based on historical data, allowing companies to stay ahead of trends rather than reacting to them. Such models are invaluable in sectors like retail and manufacturing, where anticipating demand can optimize inventory and supply chain logistics.
Frequently Asked Questions
How many Fridays are there in a normal year? Usually 52, sometimes 53 depending on the calendar.
Can this formula count multiple years? Yes, by applying it to each start and end date pair.
What if my week starts on Monday? Adjust the WEEKDAY function’s return type to match your system.
Will leap years affect the result? Yes, leap years can add an extra Friday if February 29 shifts the weekday count.
Can I adapt this to count weekends? Yes, by modifying the formula to check for Saturday and Sunday as well.

John Michaloudis is a former accountant and finance analyst at General Electric, a Microsoft MVP since 2020, an Amazon #1 bestselling author of 4 Microsoft Excel books and teacher of Microsoft Excel & Office over at his flagship MyExcelOnline Academy Online Course.


