Calculating the number of weeks in a quarter may sound simple, but when you start working with real business calendars, financial quarters, or project schedules, it can get a bit more complex. Excel users often need to analyze weekly data by quarter, create quarterly reports, or allocate resources based on weeks within a quarter. That’s why it’s helpful to know the most reliable ways to count how many weeks are in each quarter using Excel’s powerful date formulas and tools.
Key Takeaways
- There are typically 13 weeks in a standard calendar quarter, but this can vary depending on how weeks are defined.
- Excel provides several functions, such as WEEKNUM, NETWORKDAYS, and date arithmetic, to calculate week counts accurately.
- Knowing the start and end dates of each quarter is crucial for precise calculations.
- Business and fiscal quarters may not always align with calendar quarters, so formulas may need adjustment.
- Power Query and VBA can automate complex week calculations for larger datasets or recurring tasks.
Table of Contents
Understanding Quarters in Excel
Standard vs. Fiscal Quarters
In Excel, understanding quarters is crucial for effective data organization and analysis. A standard quarter divides the year into four equal parts, each consisting of three months. Therefore, a quarter typically contains 13 weeks. However, fiscal quarters can vary as they are tailor-made to fit specific business requirements. Some companies may, for example, start their fiscal year in July, dividing their year to suit financial goals and analysis metrics better. Different industries may also establish fiscal quarters that align with their peak periods, ensuring accurate and relevant quarterly reporting.
Importance of Quarters for Analysis
Quarters are pivotal in Excel for many analytical tasks. They help in segmenting data into manageable chunks, allowing for enhanced clarity in financial reporting and trend analysis. By utilizing quarters, you can easily compare performance across similar time frames, which is vital for identifying trends and making data-driven decisions. This segmentation is especially useful for businesses, helping them track performance against projected milestones without getting overwhelmed by the full year’s data. Quarters also facilitate the alignment of strategic plans with economic cycles, enabling businesses to react promptly to market changes.
How to Calculate the Number of Weeks in a Quarter in Excel
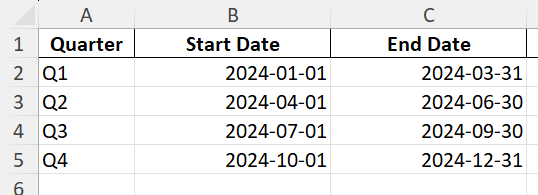
Step 1: Identify Start and End Dates for the Quarter
Enter the start date (e.g., 1/1/2024) in cell B2 and the end date (e.g., 3/31/2024) in cell C2.
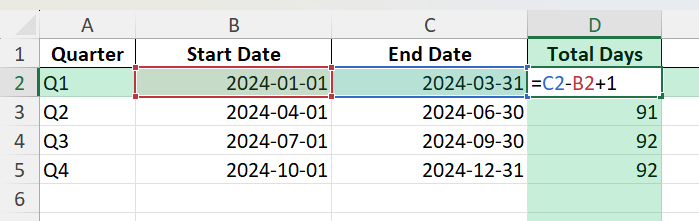
Step 2: Calculate the Total Number of Days in the Quarter
In cell D2, enter:
=C2 - B2 + 1
This formula gives the total number of days (e.g., 91 for Q1 2024).
Step 3: Calculate the Number of Weeks (Including Partial Weeks)
In cell E2, enter:
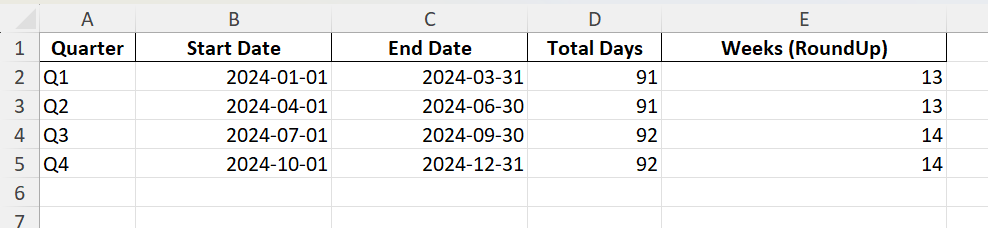
=ROUNDUP(D2/7, 0)
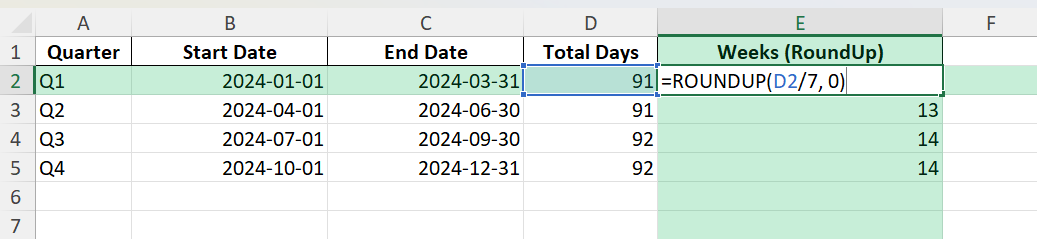
This divides the total days by 7 and rounds up to include any partial week. For example, 91/7 = 13, so there are 13 weeks in the quarter.
Common Mistakes and Tips
Mistake: Not accounting for partial weeks
If you simply divide by 7 and use INT or ROUNDDOWN, you might miss a partial week at the end. Use ROUNDUP to include all days.
Mistake: Ignoring the first/last day in your calculation
Always add 1 to include both the start and end date in your calculation (=B2-A2+1).
Tip: Adjust for custom fiscal quarters
If your fiscal quarters do not align with calendar quarters, change the start and end dates accordingly.
Tip: Week start day matters
Use the correct “return_type” argument in WEEKNUM for your organization (1=Sunday, 2=Monday).
Tip: Use helper columns for clarity
Break down calculations into steps in separate columns to make your formulas easier to audit and update.
Bonus Tips and Advanced Scenarios
Using Power Query to List Weeks in a Quarter
You can use Power Query to generate a list of all week start dates within a quarter, making it easy to summarize or group data by week.
Automating with VBA
Here’s a simple macro to count the number of weeks in a selected range of start/end dates:
Sub CountWeeksInQuarter()
  Dim rng As Range
  Dim i As Long
  For i = 2 To 5 'Assuming rows 2 to 5 have your data
    Cells(i, 4).Value = WorksheetFunction.RoundUp((Cells(i, 2).Value - Cells(i, 1).Value + 1) / 7, 0)
  Next i
End Sub
This macro writes the week count in column D for each row.
Counting Full Weeks Only
If you want to count only complete 7-day weeks, use:
=INT((B2 - A2 + 1)/7)
Practical Applications
Financial Reporting and Analysis
Financial reporting and analysis benefit greatly from the organization provided by quarters in Excel. Quarters allow businesses to conduct performance reviews regularly, ensuring issues are identified and addressed promptly. When financial metrics like revenue, expenses, and profit margins are tracked quarterly, patterns can be discerned that might be obscured in yearly reports.
Excel’s capability to handle quarterly data effectively enables the calculation of key financial ratios and comparisons across quarters, promoting more informed strategic decisions. Businesses can forecast future trends by examining quarter-on-quarter growth and adjust their strategies accordingly. Additionally, quarterly financial reports can enhance communication with stakeholders by providing them with detailed and timely financial snapshots.
Enhancing Date Functionality with Excel
Excel’s advanced date functionalities significantly enhance the analysis of quarterly data. Features such as QUARTER() and custom functions enable efficient sorting and categorization of data by quarters, streamlining complex data sets into comprehensible units of time. By leveraging Excel’s conditional formatting and pivot tables, users can visualize quarterly trends and performances at a glance, highlighting important dates and cyclical patterns.
Moreover, combining these date functions with Excel’s automation capabilities, such as Power Query, allows for real-time updates and seamless integration of data from various sources. This level of automation reduces manual errors and boosts the reliability of quarter-based reports. Such robust functionality turns Excel into a dynamic tool for making data-driven decisions, ensuring you have up-to-date insights at your fingertips.
FAQ
Q: Are there always 13 weeks in every quarter?
A: Most quarters have 13 weeks, but leap years or fiscal calendars with custom start/end dates can cause small differences.
Q: How does Excel handle weeks that cross over quarters?
A: If a week starts in one quarter and ends in the next, it will be counted based on how you define your start and end dates. Consider how you want to report partial weeks.
Q: Can I automate this for multiple years?
A: Yes, you can use formulas, Power Query, or VBA to automate quarter calculations for any period.
Q: What if my company uses 4-4-5 or 13-period accounting?
A: Adjust your date ranges and calculation logic to fit your organization’s quarter structure. The process remains similar.
Q: How do I list all week start or end dates within a quarter?
A: Use a formula to generate a sequence of dates (e.g., with SEQUENCE or Power Query) starting from the quarter’s first day and incrementing by 7.

John Michaloudis is a former accountant and finance analyst at General Electric, a Microsoft MVP since 2020, an Amazon #1 bestselling author of 4 Microsoft Excel books and teacher of Microsoft Excel & Office over at his flagship MyExcelOnline Academy Online Course.


