Calculating a batting average is a common task for anyone tracking baseball or softball statistics, whether you’re a coach, a player, or just a fan. Excel provides an efficient way to record, analyze, and visualize player performance. By using simple formulas and a few Excel tricks, you can quickly determine batting averages, create leaderboards, and avoid common errors. This post will walk you through each step to ensure accurate, professional results.
Key Takeaways
- The batting average formula is Hits divided by At Bats: =Hits / At Bats.
- Excel makes it easy to track player stats and automatically calculate batting averages for single games or full seasons.
- Formatting results as a decimal (e.g., .325) or a percentage is straightforward with Excel’s Number and Percentage formats.
- You can quickly apply the formula to entire columns for multiple players or games.
- Advanced users can add conditional formatting, automate calculations, and visualize trends with charts or Power Query.
Table of Contents
Understanding Batting Average in Excel
A batting average measures how often a baseball or softball player gets a hit. The formula is simple:
Batting Average = Hits / At Bats
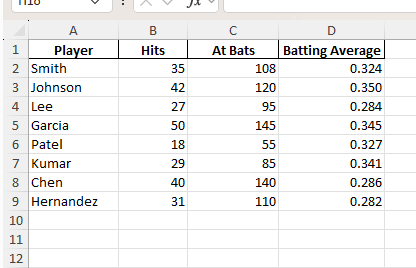
For example, if a player has 35 hits in 108 at bats, their batting average is 35 ÷ 108 = 0.324 (rounded to three decimal places). In Excel, you can set up a table and use a formula to calculate this for any player or group of players.
Setting Up Your Spreadsheet
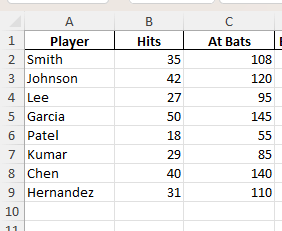
To kick off your journey with calculating batting averages in Excel, you’ll need a well-organized spreadsheet. Begin by opening Excel and creating a new worksheet. Designate specific columns for player names, number of hits, and at-bats. This layout will simplify data entry and keep everything organized.
Use the first column for player names, ensuring each name is unique. The next column should be for at-bats, indicating how many times a player has batted. Follow this with a column for hits, recording the number of times they successfully secured a hit. Label your columns clearly for easy reference.
Inputting Player Data
Once your spreadsheet setup is ready, you can start inputting player data. Populate the first column with each player’s name, using a new row for each to maintain readability. In the subsequent columns, input the number of at-bats and hits per player.
Ensuring the accuracy of this data is crucial, as errors can lead to incorrect batting averages. Double-check each entry for typos or misplaced values. It’s helpful to refer to the most recent team stats if available. Regular updates keep the spreadsheet current and reliable. For a smoother process, consider using drop-down menus or data validation to limit potential entry errors.
Step-by-Step Guide: Calculating Batting Average in Excel
Step 1: Set Up Your Data Table
Create a table with columns: Player, Hits, At Bats.
Step 2: Enter the Batting Average Formula
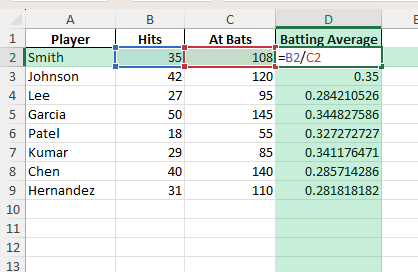
In a new column, type Batting Average.
In the first row under Batting Average (e.g., D2), enter the formula:
=B2/C2
Copy the formula down to calculate the batting average for each player.
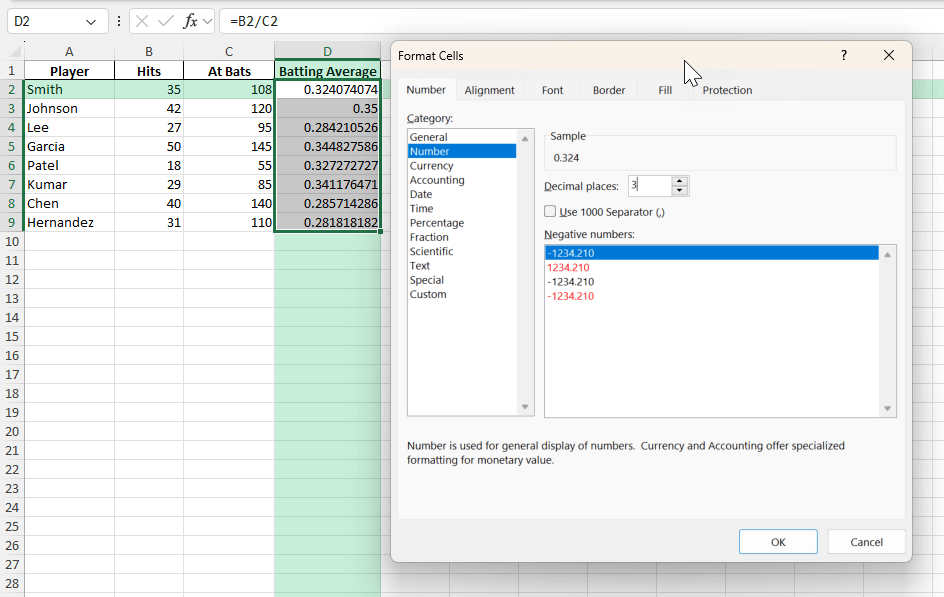
Step 3: Format the Batting Average
Select the Batting Average column.
Right-click and choose Format Cells.
Select Number and set Decimal places to 3 (e.g., .324).
Common Mistakes and Tips
Mistake: Dividing by zero. If At Bats is zero, Excel returns a #DIV/0! error.
Tip: Use =IF(C2=0,"",B2/C2) to prevent errors.
Mistake: Forgetting to use decimal formatting.
Tip: Always format as Number with three decimals for standard baseball reporting.
Mistake: Including walks, sacrifices, or hit-by-pitches in At Bats.
Tip: Only count official at bats for accuracy.
Tip: Use cell references for formulas instead of typing numbers directly.
Tip: Add player names to make sorting and filtering easier.
Bonus Tips and Advanced Scenarios
Conditional Formatting: Highlight batting averages above .300 for top performers.
Power Query: Import season stats from a CSV file and calculate averages for each player.
VBA Macro Example:
Sub CalculateBattingAverage()
    Dim ws As Worksheet
    Set ws = ActiveSheet
    Dim lastRow As Long
    lastRow = ws.Cells(ws.Rows.Count, "A").End(xlUp).Row
    Dim i As Long
    For i = 2 To lastRow
        If ws.Cells(i, 3).Value <> 0 Then
            ws.Cells(i, 4).Value = ws.Cells(i, 2).Value / ws.Cells(i, 3).Value
        Else
            ws.Cells(i, 4).Value = ""
        End If
    Next i
End Sub
This fills the Batting Average column for each row.
Advanced Tips and Tricks
Automating Calculations Using Excel Features
Automating your Excel calculations can save significant time and enhance efficiency, especially when dealing with extensive player datasets. Here are some Excel features that can bolster automation:
- Formulas and Functions: Beyond basic division, Excel offers functions like
AVERAGEIFandSUMIFto aggregate data based on specified criteria, streamlining the calculation of team or league averages. - Data Tables: Transform your player data into an Excel Table. This not only improves the aesthetic and functionality but also allows formulas to auto-update as new data is added.
- Macros: For repetitive tasks, consider recording macros. Recording a macro captures a series of steps in Excel, which can be executed automatically with a single click or keystroke.
- Power Query: Use Power Query for extracting, transforming, and loading data. It automates the data refresh process, keeping your spreadsheet’s statistics up-to-date with minimal manual intervention.
- Named Ranges: Instead of manually adjusting the formula references with data changes, use named ranges. This feature assigns a name to a set of cells, which remains constant even if the cells move or adjust.
Visualizing Data with Charts and Graphs
Visualizing data with charts and graphs can provide a clearer picture of player performance trends. Here’s how you can effectively use Excel’s visualization tools for your batting average data:
- Bar Charts: Use bar charts to compare batting averages across players. This visual representation makes it easy to identify top performers at a glance.
- Line Graphs: Line graphs are ideal for tracking a player’s batting average over time. By plotting each game or series, you can observe fluctuations and identify potential patterns or areas for improvement.
- Scatter Plots: For a more detailed analysis, scatter plots can show the relationship between at-bats and hits, helping to visualize consistency and identify outliers.
- Pie Charts: Although less common for averages, pie charts can represent team compositions, such as the proportion of total hits or at-bats contributed by each player.
- Dynamic Dashboards: Create dynamic dashboards to visualize multiple data points simultaneously. By linking charts to slicers or dropdowns, you can easily filter data by specific players or time frames.
Comparing Multiple Players
Excel makes it easy to compare multiple players’ batting averages side by side, providing insights into their effectiveness and consistency. Here’s how to do it:
- Side-by-Side Charts: Create a clustered column chart to display each player’s batting average alongside others. This format highlights differences and allows quick visual comparisons.
- Pivot Tables: Use pivot tables to aggregate and compare players based on custom criteria such as specific games, opponents, or even weather conditions during games. This feature condenses large datasets into easy-to-navigate summaries.
- Rankings: Employ the
RANKfunction to order players based on their averages. This function can automatically update as data changes, providing an ongoing hierarchy of player performance. - Heat Maps: Utilize conditional formatting to create a heat map where players with higher averages are displayed in contrasting colors. This method immediately draws attention to high and low performers.
- Benchmarking: Compare each player’s performance to league averages or historical benchmarks. This can contextualize individual statistics within broader patterns and trends.
FAQ
Q: What is the formula for batting average in Excel?
A: =Hits / At Bats (e.g., =B2/C2).
Q: How do I round the batting average to three decimals?
A: Format cells as Number with 3 decimal places, or use =ROUND(B2/C2,3).
Q: Can I calculate averages for multiple games or players?
A: Yes, copy the formula down for each player or game.
Q: How do I handle zero at bats?
A: Use =IF(C2=0,"",B2/C2) to avoid errors.
Q: Can I automate this with VBA or Power Query?
A: Yes, see the VBA code above or use Power Query for larger datasets.

John Michaloudis is a former accountant and finance analyst at General Electric, a Microsoft MVP since 2020, an Amazon #1 bestselling author of 4 Microsoft Excel books and teacher of Microsoft Excel & Office over at his flagship MyExcelOnline Academy Online Course.


