Formulas are the foundation of Excel. Whether you are calculating totals, averages, percentages, or building complex financial models, formulas help you transform data into meaningful information. This guide will walk you through the steps how to enter a formula, understand their structure, and use them effectively in your spreadsheets.
Key Takeaways
- Formulas in Excel always begin with the equal sign (=).
- You can use arithmetic operators (+, -, *, /) to build simple formulas quickly.
- Cell references make formulas dynamic and reusable across multiple cells.
- Excel offers hundreds of built-in functions like SUM, AVERAGE, and IF for advanced calculations.
- Practice with real examples to build confidence and reduce errors.
Table of Contents
Understanding Formulas in Excel
A formula in Excel performs a calculation or operation on one or more values. These values can be numbers, cell references, ranges, or functions. The simplest formula might be =2+2, while complex ones can combine multiple functions like =IF(SUM(A1:A10)>100,"Pass","Fail").
Step-by-Step: How to Enter a Formula
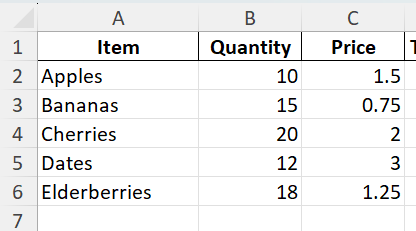
Step 1: Prepare Your Data
Start with a simple dataset. For example, suppose you have a table listing items, their quantities, and prices. You want to calculate the total cost for each item by multiplying quantity by price.
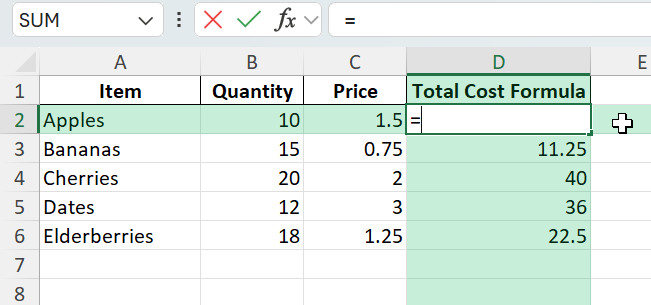
Step 2: Select the Cell for the Formula
Click the cell where you want the result to appear. For example, select D2 to calculate the total cost for Apples.
Step 3: Type the Equal Sign
Every formula in Excel must start with =. This tells Excel you are entering a calculation rather than text.
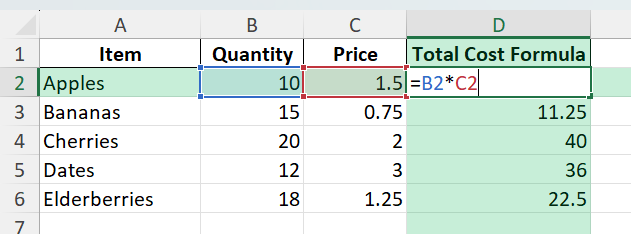
Step 4: Build Your Formula
Type the cell references and arithmetic operators. For example:
=B2*C2This multiplies the value in cell B2 (Quantity) by the value in C2 (Price).
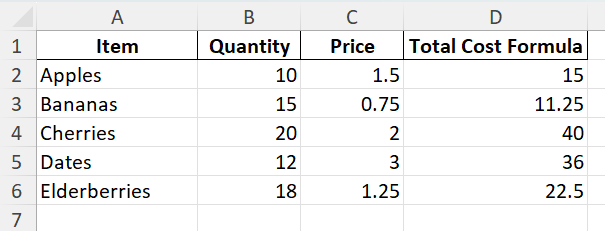
Step 5: Press Enter
After typing the formula, press Enter. Excel will display the result of the calculation in the selected cell.
Step 6: Copy the Formula
To apply the same formula to other rows, drag the fill handle (small square at the bottom-right corner of the cell) down to copy the formula to other cells like D3, D4, etc. Excel automatically adjusts the references for each row.
Using Functions in Formulas
Excel provides many built-in functions to perform common calculations quickly. Some examples:
=SUM(B2:B6) adds up all the quantities.
=AVERAGE(C2:C6) calculates the average price.
=IF(D2>20,"High","Low") checks if total cost is above 20.
Common Mistakes and How to Fix Them
Forgetting the equal sign: Always start with =, otherwise Excel treats the input as text.
Incorrect cell references: Double-check that you are pointing to the right cells.
Mixing relative and absolute references: Use $ signs for absolute references, like $B$2, when copying formulas across cells.
Extra spaces or symbols: Remove unnecessary spaces or characters that can cause formula errors.
Not closing parentheses: If using functions, ensure all parentheses match correctly.
Bonus Tips and Advanced Scenarios
Named Ranges: Assign a name to a cell or range (e.g., “Prices”) and use it in formulas like =SUM(Prices).
Power Query: Import and transform data before performing calculations, reducing manual work.
VBA Automation: Use macros to create or update formulas automatically. For example:
Sub AddFormula()
    Range("D2:D6").Formula = "=B2*C2"
End Sub
Use Cases for Entering Formulas in Excel
Formulas are essential in almost every spreadsheet scenario. Below are detailed examples covering business, finance, project management, academic research, and personal productivity with practical guidance for each area.
1) Business Reports and Performance Tracking
Context: Companies rely on monthly or quarterly reports to understand sales performance, profit margins, and operational efficiency. Manual calculations in such reports take time and can lead to errors if the data changes frequently.
How to use in Excel:
Maintain raw data for sales, expenses, and revenue in structured tables.
Use formulas like =SUM(), =AVERAGE(), and =IF() to calculate totals, averages, and conditional results.
Combine =VLOOKUP() or =XLOOKUP() to fetch sales targets or department benchmarks automatically.
Build percentage calculations with formulas like =Profit/Revenue to monitor margins.
Benefits:
Reports update automatically when new data is added.
Accurate comparisons between planned and actual performance.
Time savings when preparing weekly or monthly dashboards.
2) Financial Analysis and Forecasting
Context: Budgeting and forecasting involve multiple variables such as revenue growth rates, cost assumptions, and interest rates. Manual calculations make scenario testing difficult.
How to use in Excel:
Create budget templates with columns for assumptions, actual data, and forecasts.
Use formulas like =FV() (Future Value) or =NPV() (Net Present Value) to analyze long-term financial outcomes.
Apply =IF() and =CHOOSE() for scenario analysis, letting you toggle between best, base, and worst-case situations.
Link multiple sheets with formulas to consolidate departmental budgets into a master file.
Benefits:
Dynamic financial models that adapt when assumptions change.
Quick preparation of sensitivity analyses for management decisions.
Centralized calculations reduce errors in manual consolidation.
3) Project Management and Task Tracking
Context: Project managers track deadlines, costs, and progress across tasks and phases. Without formulas, updates become repetitive and risk inconsistencies.
How to use in Excel:
Maintain start dates, end dates, and task durations in one table.
Use date formulas like =TODAY() and =NETWORKDAYS() to calculate remaining days or working time between milestones.
Apply conditional formulas like =IF(Completion%<100,"In Progress","Complete") to flag task status.
Combine with =SUM() to monitor cumulative costs against budgets.
Benefits:
Real-time visibility of project timelines and costs.
Automated progress tracking without manual updates.
Clear status reports for stakeholders and team members.
4) Academic Research and Data Analysis
Context: Researchers and students handle experimental data, survey responses, or lab measurements. Calculations must be accurate and repeatable to support credible conclusions.
How to use in Excel:
Import raw datasets into Excel and organize them into columns for variables and observations.
Use formulas like =AVERAGE(), =STDEV.P(), or =VAR.P() for statistical analysis.
Apply logical tests like =IF() and =COUNTIF() to filter results based on conditions.
Create charts that link to formula-driven tables so graphs update automatically when data changes.
Benefits:
Consistent analysis workflows across multiple experiments.
Reduced time spent recalculating metrics after dataset updates.
Improved reproducibility of results for academic publications.
5) Personal Productivity and Household Management
Context: Individuals use Excel for day-to-day tasks like expense tracking, fitness goal monitoring, or vacation planning. Manual calculations make it harder to see trends or plan ahead.
How to use in Excel:
Log monthly expenses with columns for Category, Date, and Amount.
Use =SUMIF() or =SUMIFS() to total spending by category or month automatically.
Set up savings goals with formulas like =Target-CurrentBalance to calculate remaining amounts needed.
Track calorie intake or exercise sessions using daily logs combined with =AVERAGE() for weekly summaries.
Benefits:
Better financial awareness through automated summaries.
Clear visibility of personal goals and progress over time.
Reusable templates for recurring household planning activities.
FAQ
Do formulas work with text?
Some formulas like =CONCATENATE() or =TEXT() work with text, but arithmetic operations require numbers.
Can I combine multiple functions?
Yes, Excel allows nested functions, such as =IF(SUM(A1:A10)>100,"Pass","Fail").
What if I get a #VALUE! error?
This usually means there is a mismatch in data types. Check for text in numeric cells.
How can I lock a reference when copying formulas?
Use $ signs, for example $B$2, to make a reference absolute.
Do formulas update automatically?
Yes, Excel recalculates formulas whenever the referenced data changes.

John Michaloudis is a former accountant and finance analyst at General Electric, a Microsoft MVP since 2020, an Amazon #1 bestselling author of 4 Microsoft Excel books and teacher of Microsoft Excel & Office over at his flagship MyExcelOnline Academy Online Course.


