When analyzing data, it is often useful to find local max and min points. These are values that are higher or lower than their immediate neighbors. In Excel, identifying local peaks and troughs can help with trend analysis, detecting performance highs and lows, or spotting anomalies in datasets.
Key Takeaways
- A local maximum is higher than both its immediate neighbors.
- A local minimum is lower than both its immediate neighbors.
- Excel formulas using
IFandANDcan identify local peaks and troughs. - Helper columns make results easier to read and interpret.
- VBA can automate local max/min detection for large datasets.
Table of Contents
Understanding Local Max and Min
A local maximum is a data point that is greater than the points immediately before and after it. Similarly, a local minimum is smaller than its immediate neighbors. Unlike global maxima or minima, which represent the highest or lowest values in an entire dataset, local maxima and minima show smaller, localized changes in the data.
Maxima and minima refer to the highest and lowest points, respectively, within a specific range or dataset. In Excel, these terms are crucial for identifying data trends and patterns. Local maxima are peak points where surrounding values are smaller, while local minima are troughs where surrounding values are higher. These points are vital in revealing critical changes within datasets, helping you make informed decisions.
To effectively locate these points in Excel, understanding the nature and behavior of your data is essential. You can begin by using simple formulas like MAX() and MIN() for a quick overview, but local points within complex datasets require more advanced techniques, such as conditional formatting or specialized formulas.
Importance in Data Analysis
Identifying local maxima and minima in data analysis is essential as it uncovers significant insights that might be overlooked with a broader view. These points highlight changes in trends, enabling you to anticipate periods of growth or decline. For instance, in financial data, local maxima might indicate peak revenue months, while local minima can flag downturns, allowing for strategic planning.
Moreover, in scientific research or quality control, recognizing these points helps in monitoring system stability and understanding the underlying patterns. By analyzing these fluctuations, you can gain deeper insights into variables affecting your data and refine processes for better outcomes.
Step-by-Step: Finding Local Max and Min in Excel
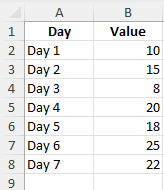
Enter your data: Create a table with labels and values.
Day     Value
Day 1   10
Day 2   15
Day 3   8
Day 4   20
Day 5   18
Day 6   25
Day 7   22
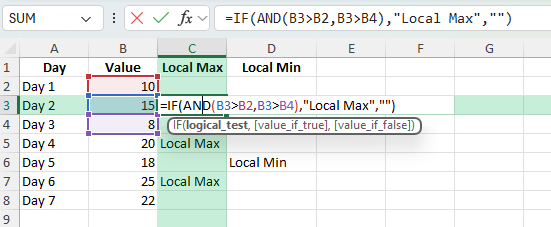
Add a helper column for Local Max: Use the formula:
=IF(AND(B2>B1,B2>B3),"Local Max","")
Where:
- B2 is the current value.
- B1 is the previous value.
- B3 is the next value.
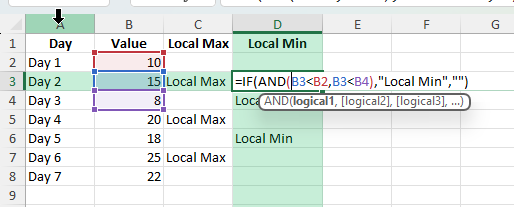
Add a helper column for Local Min: Use:
=IF(AND(B2<B1,B2<B3),"Local Min","")
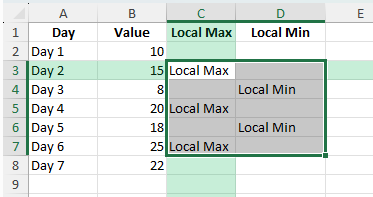
Copy the formulas down: Apply the formulas to all rows except the first and last, as they have no two-sided neighbors.
Common Mistakes and How to Avoid Them
Including first or last data points: These cannot be local maxima or minima as they lack two neighbors.
Incorrect references: Ensure the formula references the correct previous and next rows.
Not handling ties: If values are equal, adjust logic if you want to treat them differently.
Bonus Tips and Advanced Scenarios
Highlighting with Conditional Formatting: Apply rules to color cells where the formula result is “Local Max” or “Local Min”.
Power Query Method: Add an index column, then use custom logic to compare each row to its neighbors and flag peaks or troughs.
VBA Macro Automation:
Sub FindLocalMaxMin()
    Dim i As Long
    For i = 2 To Cells(Rows.Count, 2).End(xlUp).Row - 1
        If Cells(i, 2).Value > Cells(i - 1, 2).Value And Cells(i, 2).Value > Cells(i + 1, 2).Value Then
            Cells(i, 3).Value = "Local Max"
        ElseIf Cells(i, 2).Value < Cells(i - 1, 2).Value And Cells(i, 2).Value < Cells(i + 1, 2).Value Then
            Cells(i, 3).Value = "Local Min"
        End If
    Next i
End Sub
Advanced Techniques
Utilizing VBA Scripts
For those looking to delve deeper into data analysis, utilizing VBA (Visual Basic for Applications) scripts in Excel can be a game-changer. VBA allows you to create custom functions that automate the identification of local maxima and minima within your datasets. This is particularly useful when dealing with large datasets where manual identification would be tedious and error-prone.
To implement a VBA script, you’ll need to access the Developer tab in Excel, allowing you to write or import scripts. A typical script for finding local maxima might involve looping through a dataset, comparing each point to its neighbors, and tagging peaks. This process not only saves time but also increases accuracy in your analysis.
Leveraging Add-Ins for Enhanced Functionality
Excel add-ins can significantly enhance the functionality of your standard Excel toolkit, providing more robust solutions for locating local maxima and minima. These add-ins, often third-party tools, introduce advanced analytical capabilities that go beyond Excel’s native formulas. They are particularly useful for users who require more sophisticated data analysis tools without the need to write complex VBA scripts.
Add-ins such as “Solver” allow for advanced statistical analysis, including optimization functions that help to pinpoint local extrema efficiently. Other add-ins can offer graphical visualizations and trend analysis tools that make identifying these points more intuitive and visually appealing. This can be especially beneficial for presenting data findings to stakeholders who might not be as familiar with raw numerical data.
Frequently Asked Questions
What is the difference between local and global max/min? Local max/min are relative to immediate neighbors, while global max/min are highest or lowest in the entire dataset.
Can I find local max/min for text values? Not directly; the logic applies to numeric values.
Do I need to sort the data? No, you should keep the original order since position matters for local calculations.
Can I handle ties? Yes, adjust the formula to include equal signs if needed.
Can I run this on multiple columns? Yes, apply the logic to each column separately.

John Michaloudis is a former accountant and finance analyst at General Electric, a Microsoft MVP since 2020, an Amazon #1 bestselling author of 4 Microsoft Excel books and teacher of Microsoft Excel & Office over at his flagship MyExcelOnline Academy Online Course.


