Understanding data distribution is a key part of data analysis, and skewness is a powerful way to describe the shape of your data. A negatively skewed distribution (or left-skewed distribution) means that most values are clustered toward the higher end, with a long tail on the left. This type of distribution is common in test scores, income data, or whenever there are a few very low outliers. In Excel, you can identify, visualize, and analyze negatively skewed data using formulas, charts, and advanced features. This guide will show you how to do it step by step.
Key Takeaways
- Negatively skewed (left-skewed) distributions have a longer tail on the left side.
- Excel’s SKEW and SKEW.P functions help you measure skewness numerically.
- Histograms and box plots in Excel visually highlight data skew.
- Power Query and VBA can automate skewness calculations and reporting.
- Identifying skewness is useful in business, finance, education, and quality control.
Table of Contents
About Negatively Skewed Distribution in Excel
A negatively skewed distribution means that a small number of unusually low values pull the average down, while most data points are at or above the mean. In statistical terms, the skewness value is negative. Recognizing and working with skewed data can help you make better business decisions, set realistic targets, and spot data quality issues.
Left-skewed = negatively skewed = tail to the left.
Examples: housing prices with a few very low-priced homes, exam scores where most students did well.
Skewness near 0 means data is symmetric, less than 0 means left skewed, more than 0 means right skewed.
Understanding Skewness in Excel
What is Skewness?
Skewness in statistical terms refers to the degree of asymmetry observed in a distribution. When a dataset is perfectly symmetrical, it has no skewness. However, if it leans more to one side, it manifests as skewness. In Excel, you can use the SKEW function to calculate this measure, offering insights into the dataset’s distribution and balance.
Key Differences Between Positive and Negative Skewness
Positive skewness occurs when the tail on the right side of the distribution is longer or fatter than the left side. This means most data points are concentrated on the left, with more extreme values extending the tail toward the right. Conversely, negative skewness implies a longer tail on the left, with data points clustering towards the right side.
In Excel, the difference becomes evident when using graphs or evaluating the SKEW function’s results. A positively skewed distribution will yield a positive skewness value, while a negatively skewed distribution will present a negative one. These distinctions aid in understanding data variations and potential biases.
How to Measure and Visualize Negative Skewness in Excel
Step 1: Enter Your Data
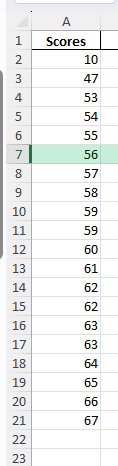
List your data points in a column (for example, A2:A21).
Example data (already left-skewed):
10, 47, 53, 54, 55, 56, 57, 58, 59, 59, 60, 61, 62, 62, 63, 63, 64, 65, 66, 67
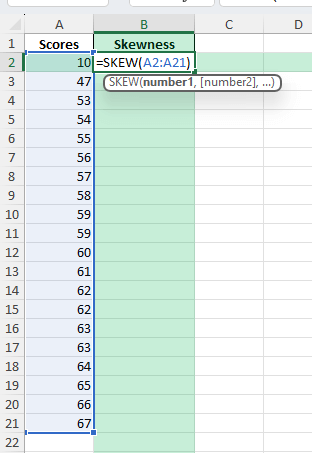
Step 2: Calculate Skewness
In a new cell, enter:
=SKEW(A2:A21)
Result will be a negative number for left-skewed data.
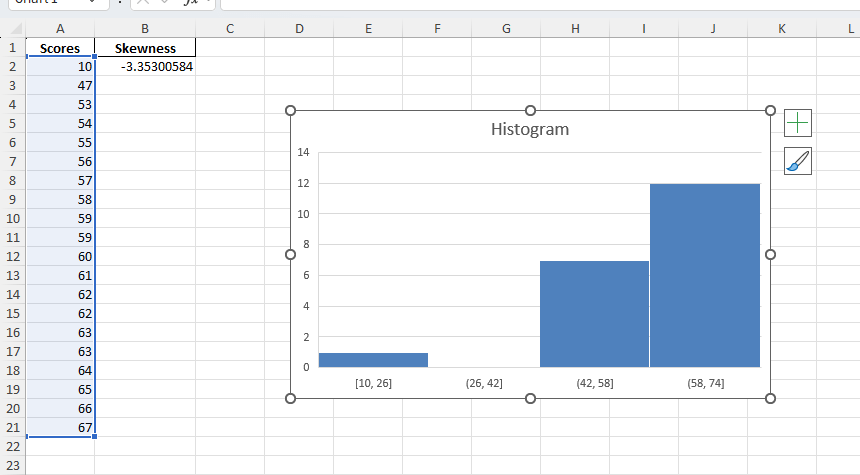
Step 3: Create a Histogram
Select your data range (A2:A21).
Go to Insert > Charts > Histogram (in the “Statistical” group).
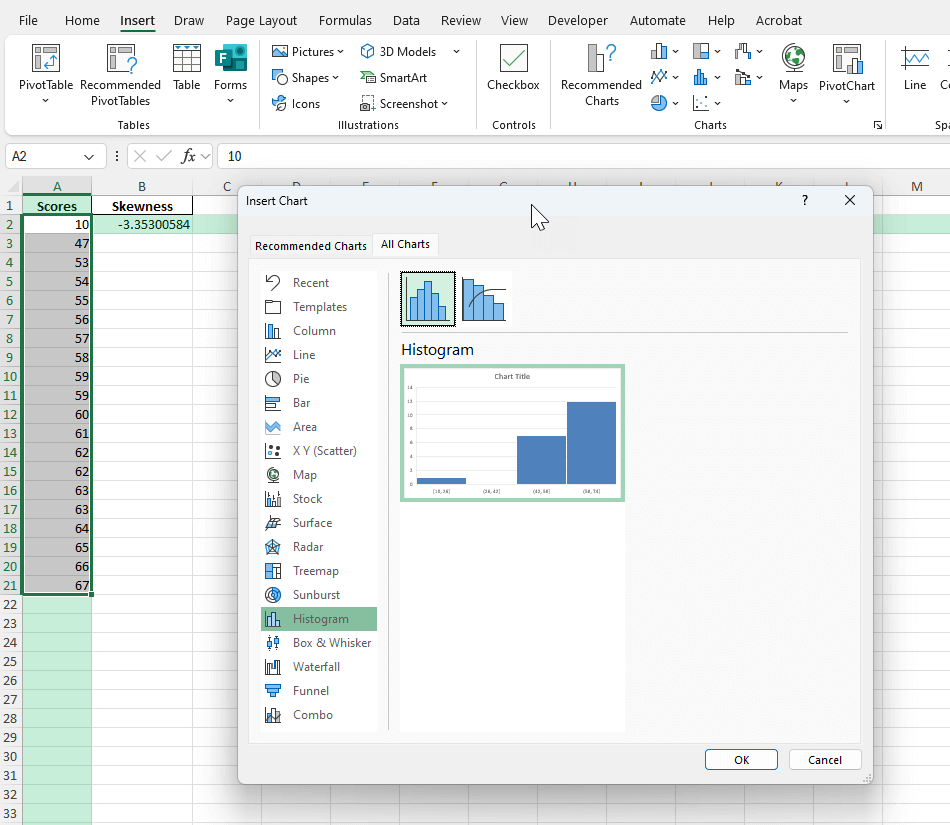
Look for a long tail on the left (bars higher on the right).
Common Mistakes and Tips
Mistake: Using SKEW on very small datasets
Skewness calculations are more reliable with larger data sets.
Mistake: Ignoring data entry errors
Outliers caused by errors can create false skewness.
Tip: Use histograms or box plots along with the skewness number for a more complete picture.
Tip: In Power Query, filter or flag extreme values before skew analysis.
Tip: Use SKEW.P for population data, SKEW for sample data.
Bonus Tips and Advanced Scenarios
Power Query Automation: Calculate skewness or flag outliers on import.
VBA Macro for Skewness:
Sub CalcSkewness()
    MsgBox Application.WorksheetFunction.Skew(Range("A2:A21"))
End Sub
Custom Bins in Histogram: Manually set bins to improve visual clarity for skewed data.
Practical Applications of Negative Skewness
Interpreting Results for Business Decisions
Understanding the implications of a negatively skewed distribution is crucial for informed business decisions. When you encounter such skewness, it often implies that there are more extreme low values impacting the data than high ones.
- Risk Assessment: In risk management, a negatively skewed ROI might indicate potential losses more than the expected gains, calling for cautious investment strategies.
- Customer Analysis: For customer purchase behavior, a negative skewness might mean a handful of transactions are significantly lower than the average, possibly pointing to issues with certain product lines or services.
- Performance Metrics: In performance assessment, such skewness can unearth inefficiencies requiring strategic shifts to align operations with set targets.
- Revenue Forecasting: When forecasting revenue, understanding this skewness can help adjust projections and budget allocations to mitigate risks.
By interpreting negatively skewed data adeptly, businesses can tailor strategies to ensure stability and growth.
Examples from Financial Analysis
In financial analysis, negatively skewed distributions can provide insights into market patterns and potential risks:
- Stock Returns: Analysts often examine stock returns, which might show negative skewness. This indicates that while many stocks follow a stable trend, there are outliers that drop significantly, which could impact investment strategies.
- Bond Yields: For bonds, a negatively skewed yield distribution may highlight a few significant downturns, suggesting caution in selections and hedging strategies to counterbalance potential losses.
- Portfolio Diversification: Investors can use skewness to diversify portfolios. A negatively skewed asset might be balanced with positively skewed options to achieve a neutral risk position.
- Market Sentiment Analysis: Negative skewness in sentiment indicators could point toward more negative market perceptions or reactions, guiding timing decisions for trades.
These applications demonstrate how understanding skewness aids in anticipating market behaviors and bolstering financial decisions.
FAQ
Q: What is a negatively skewed distribution?
A: It’s a distribution where the tail is longer on the left, with most data clustered toward higher values.
Q: How do I know if my data is left-skewed in Excel?
A: If the SKEW or SKEW.P result is less than 0, your data is left-skewed.
Q: Can I remove outliers before calculating skewness?
A: Yes, filter or flag outliers in Power Query or use conditional formatting to inspect before calculation.
Q: Does chart type matter?
A: Yes, histograms and box plots are best for visualizing skewed data.
Q: Is SKEW the same as SKEW.P?
A: SKEW is for samples, SKEW.P for entire populations. Use as appropriate for your data.

John Michaloudis is a former accountant and finance analyst at General Electric, a Microsoft MVP since 2020, an Amazon #1 bestselling author of 4 Microsoft Excel books and teacher of Microsoft Excel & Office over at his flagship MyExcelOnline Academy Online Course.


