Have you ever thought of printing out your Pivot Chart, Excel allows you print a pivot chart with just a few clicks! We will show you how to print this out and save as a pdf file.
In this guide, we’ll walk you through everything you need to know about printing a Pivot Chart in Excel. Whether you want to hand it out in a meeting, include it in a report, or save a digital copy for sharing, this tutorial will get you there confidently.
Key Takeaways:
- Pivot Charts visually represent your Pivot Tables for clear data insights.
- Printing a Pivot Chart in Excel takes just a few clicks via File → Print.
- Landscape orientation gives the best layout for charts on printed pages.
- You can save your Pivot Chart as a PDF using “Microsoft Print to PDF.”
- Formatting, layout, and previewing ensure a professional final printout.

Table of Contents
Understanding Pivot Charts and Their Importance
What is a Pivot Chart?
Before we jump into printing, let’s take a quick refresher on what a Pivot Chart actually is.
A Pivot Chart is a visual representation of a Pivot Table, which allows you to summarize, analyze, and visualize large sets of data dynamically. The beauty of Pivot Charts is that they automatically adjust when you change the underlying Pivot Table fields.
In short:
- A Pivot Table summarizes data.
- A Pivot Chart shows that summary visually.
Together, they’re a data powerhouse—and once you’ve got the chart looking just right, printing it is the cherry on top.
Why Print a Pivot Chart?
You might be wondering, why print it at all?
There are several reasons:
- Reports and Presentations: A printed Pivot Chart makes it easy to share insights in meetings or attach to printed reports.
- Record Keeping: You might need a physical record of data trends at a certain point in time.
- PDF Sharing: Saving the chart as a PDF keeps the design intact and is perfect for emailing or archiving.
Printing isn’t just old-school—it’s also about creating professional-looking visuals for real-world communication.
Printing a Pivot Chart in Excel
STEP 1: Make sure you have clicked and select your Pivot Chart. Select a spot right beside your Pivot Table.
Go to File > Print

STEP 2: Change the orientation by selecting Landscape Orientation. This ensures our Pivot Chart is shown nicely in the printout.
We have selected Microsoft Print to PDF to save this as a pdf file. Click Print and save the file.

Let us open the pdf file. You can now see your printout!

Tips & Tricks
Export as PDF Directly
There’s another way to achieve the same result—using Export as PDF:
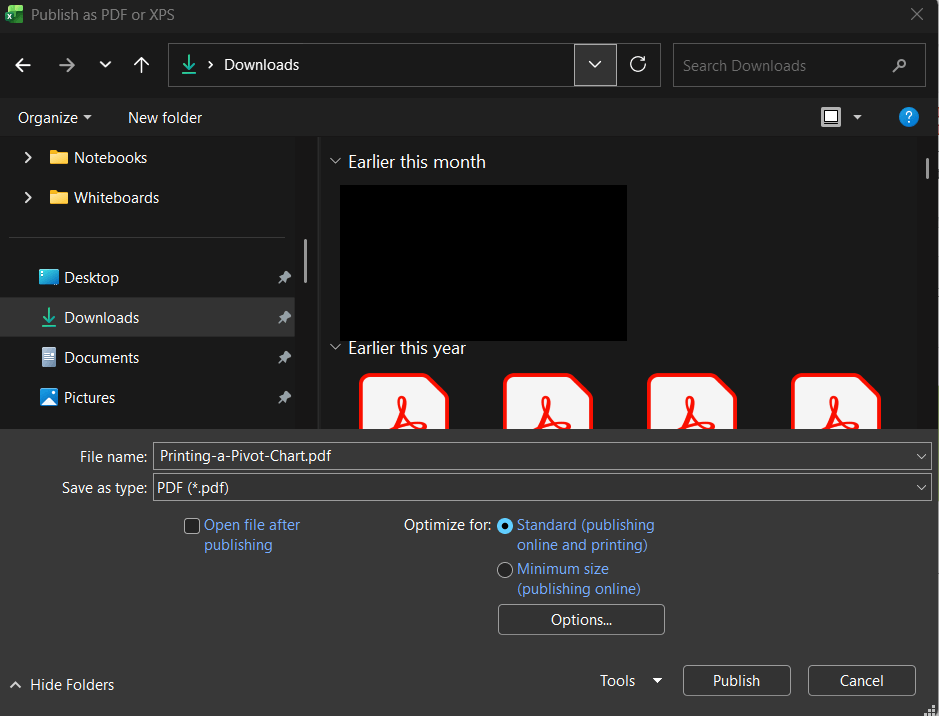
- Go to File → Export → Create PDF/XPS Document.
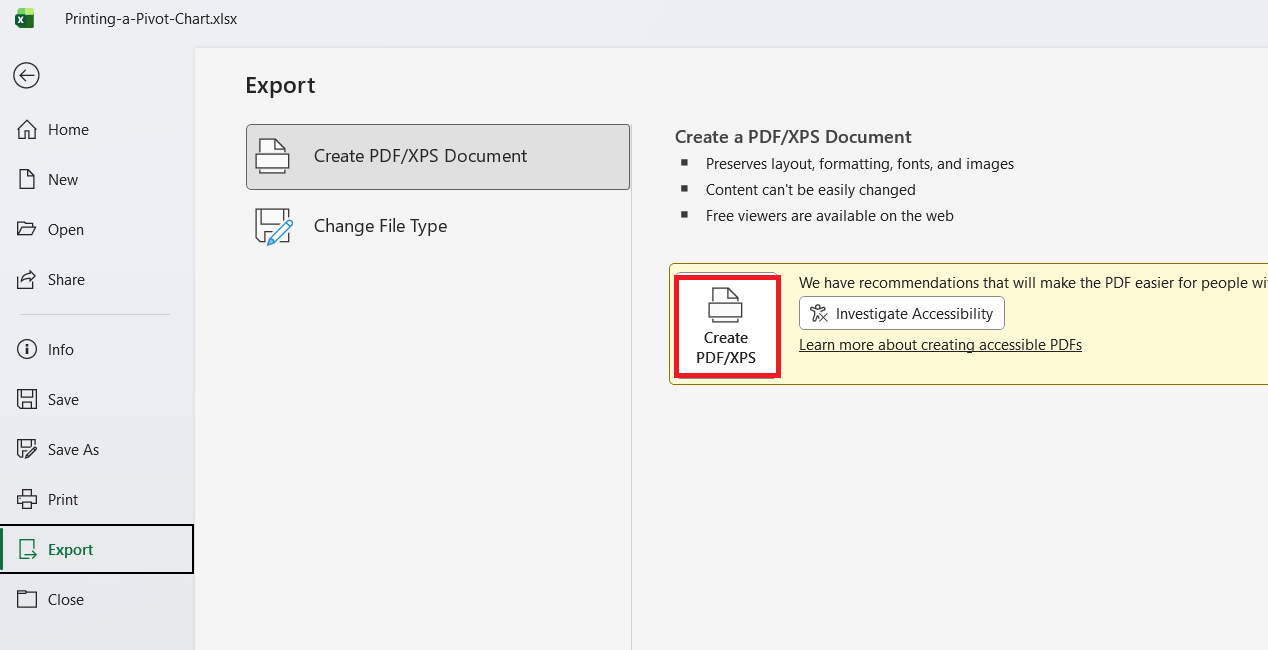
- Choose your preferred folder and name.
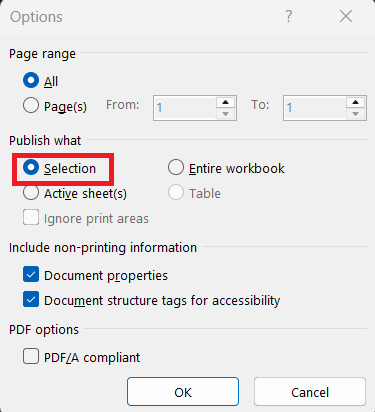
- In Options, select “Selection” if you want to print only the chart, or “Entire Workbook” if you want everything.
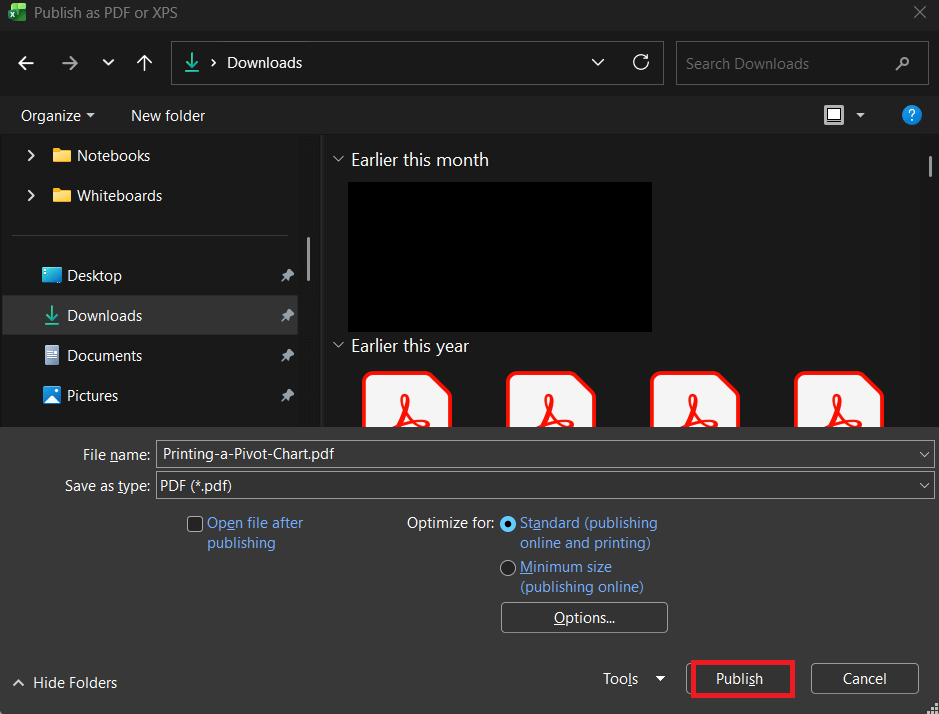
- Click Publish.
This is basically Excel’s one-click PDF export—great for when you’re in a hurry.
Additional Tips
Want to make your printed Pivot Chart stand out? Here are a few pro moves:
- Add a Chart Title and Date: Give your chart a descriptive title like “Quarterly Sales Performance” and use =TODAY() to show the current date dynamically.
- Use Consistent Formatting: Stick to simple fonts like Arial or Calibri, size 10–12 pt, for clean and professional results.
- Add a Company Logo: A small logo in the corner adds a polished, branded touch.
- Preview Before Printing: Always check File → Print Preview to ensure the layout looks right.
- Save a Template: If you print Pivot Charts regularly, save your setup as a reusable template for future reports.
FAQs
1. Can I print only the Pivot Chart without the Pivot Table?
Yes, absolutely. Excel allows you to print just the chart itself without including the Pivot Table. Simply click on the chart to select it, then go to File → Print, and under “Settings,” choose Print Selected Chart. This isolates your chart from the rest of the worksheet. It’s the perfect way to produce a clean, uncluttered report when you only want the visual summary.
2. How do I make sure my Pivot Chart fits perfectly on one page?
If your Pivot Chart looks cut off or too small, use Excel’s Scaling options in the Print Settings. You can select Fit Sheet on One Page or Fit All Columns on One Page depending on your layout. Alternatively, resize the chart manually by dragging its corners before printing. Always check the Print Preview before finalizing to ensure everything fits nicely. This quick check saves paper, time, and your sanity.
3. Why is my printed Pivot Chart blurry or low quality?
A blurry chart usually means the image resolution or scaling is off. Keep your chart at normal zoom (100%) and avoid stretching text boxes or resizing chart elements disproportionately. In the print dialog, ensure “High Quality” is enabled if available. If you’re saving as PDF, use the “Standard” quality option instead of “Minimum Size.” Doing these ensures your printed chart looks crisp and professional, not pixelated.
4. Can I automate the printing or PDF export of my Pivot Chart?
Yes, if you frequently need to export reports, you can automate the process using Excel Macros (VBA). A simple macro can print or save your Pivot Chart as a PDF in one click, reducing repetitive work. You can even schedule it to run automatically on specific data refreshes. This is useful for recurring reports like weekly sales summaries. It’s a smart way to streamline your workflow and save time every reporting cycle.
5. What’s the difference between “Print to PDF” and “Export as PDF” in Excel?
Both options create a PDF, but they work slightly differently. Print to PDF behaves like printing—it gives you control over margins, orientation, and scaling. Export as PDF, on the other hand, saves the workbook or selected area directly as a digital file with fewer settings to tweak. “Print to PDF” is ideal for precise formatting, while “Export as PDF” is faster when you just want a clean copy. Either way, you’ll get a high-quality PDF version of your Pivot Chart.

Bryan
Bryan Hong is an IT Software Developer for more than 10 years and has the following certifications: Microsoft Certified Professional Developer (MCPD): Web Developer, Microsoft Certified Technology Specialist (MCTS): Windows Applications, Microsoft Certified Systems Engineer (MCSE) and Microsoft Certified Systems Administrator (MCSA).
He is also an Amazon #1 bestselling author of 4 Microsoft Excel books and a teacher of Microsoft Excel & Office at the MyExecelOnline Academy Online Course.


