Free Practice Workbook
Pivot Tables help you summarize and analyze large amounts of data in Excel. Once you create a Pivot Table, you may want to change how the row and column fields are displayed. In this article, I will show you how to open and use Field Settings and Value Field Settings in an Excel Pivot Table.
Key Takeaways:
- Field Settings control row and column fields.
- Value Field Settings control how values are calculated.
- You can change Sum to Count, Average, Max, or Min.
- Field Settings let you show or hide subtotals.
- Both options help you customize your Pivot Table.

Table of Contents
Pivot Tables in Excel
A pivot table in Excel is a dynamic tool that lets me quickly summarize and analyze large amounts of data. Rather than going through endless rows and columns, I can use a pivot table to organize, group, and filter data with just a few clicks. This ability to restructure and condense information makes complex datasets much more manageable.
Show Field and Value Settings: Why They Matter
Field Settings and Value Field Settings are options in Excel Pivot Tables that let you control how fields and values are displayed and calculated.
- Field Settings are used for row and column fields. They allow you to change the field name, show or hide subtotals, and adjust the field layout.
- Value Field Settings are used for fields in the Values area. They let you change the calculation, such as Sum, Count, Average, Max, or Min, and display values as percentages, running totals, or differences.
Step-by-Step Guide: Using Show Field and Value Settings
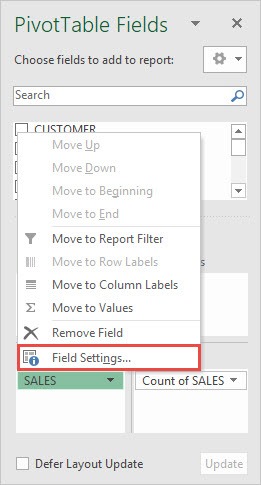
STEP 1: Let us have a look at the existing Pivot Table. To view the Field Settings, we can do the following:
Under PivotTable Fields > Rows > Field Settings
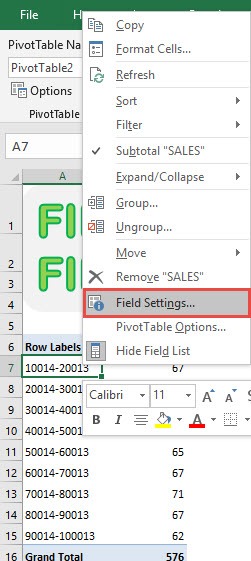
You can also right click on a Row Label and select Field Settings.
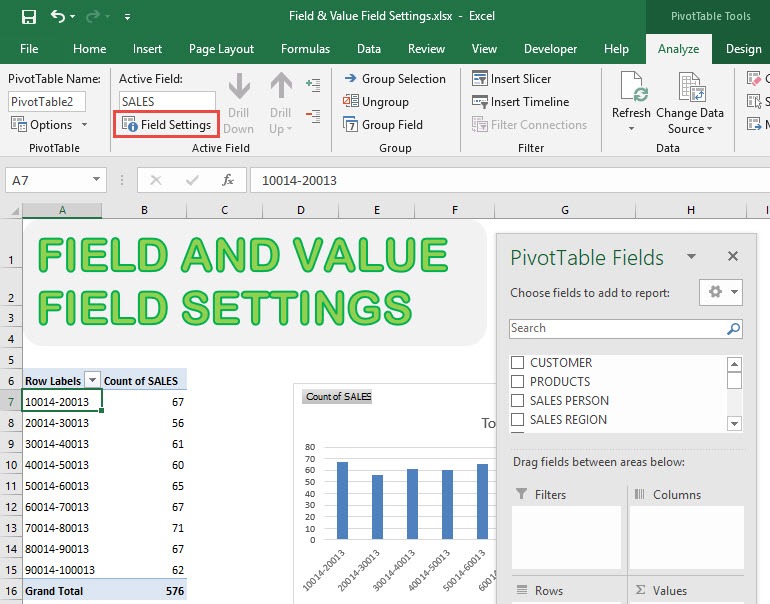
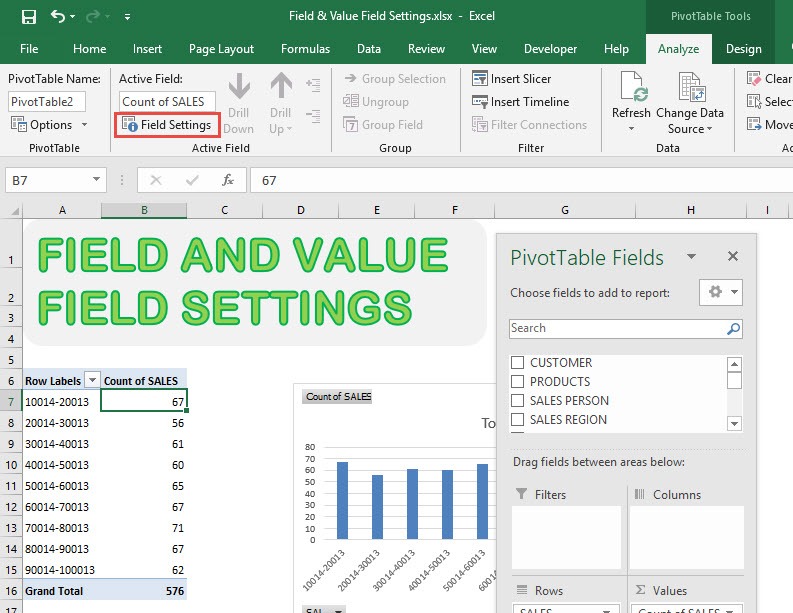
Or while having a row label selected, you can go to PivotTable Tools > Analyze > Active Field > Field Settings
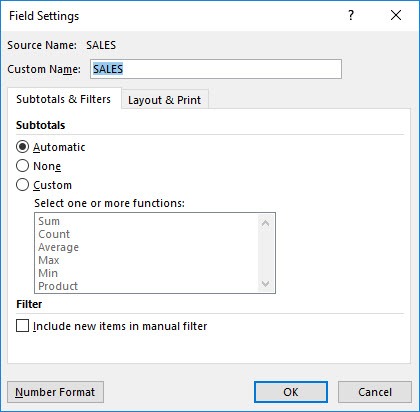
And now you have your Field Settings open!
STEP 2: Now let us see how to access the Value Field Settings.
Go to PivotTable Fields > Values> Value Field Settings
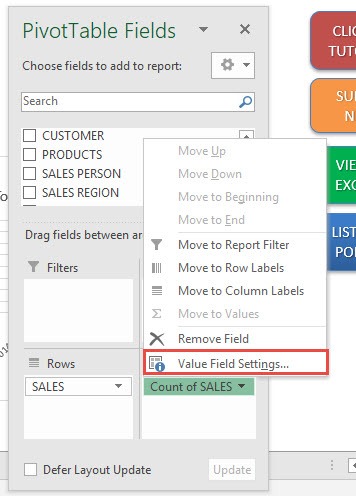
You can also right click on a Value and select Value Field Settings.
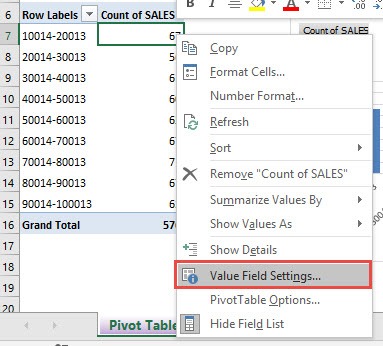
Or while having a value selected, you can go to PivotTable Tools > Analyze > Active Field > Field Settings
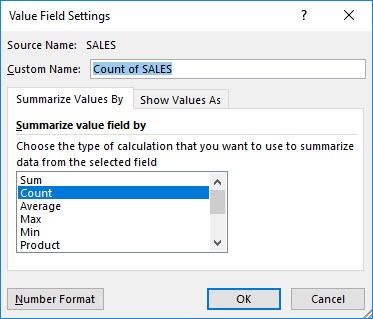
You now have your Value Field Settings!
Tips & Tricks
- I often add the same field twice, then set one to ‘Sum’ and another to ‘Average’.
- I double-click field headings in the pivot table to rename them. This makes the reports easier to understand.
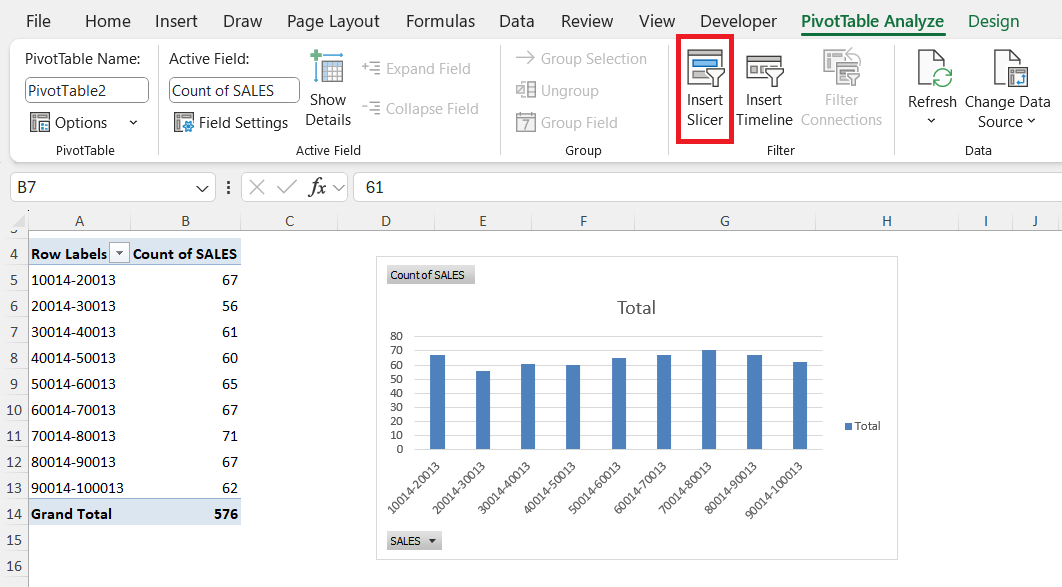
- I use Pivot Table filters and slicers so that you can focus on specific data.
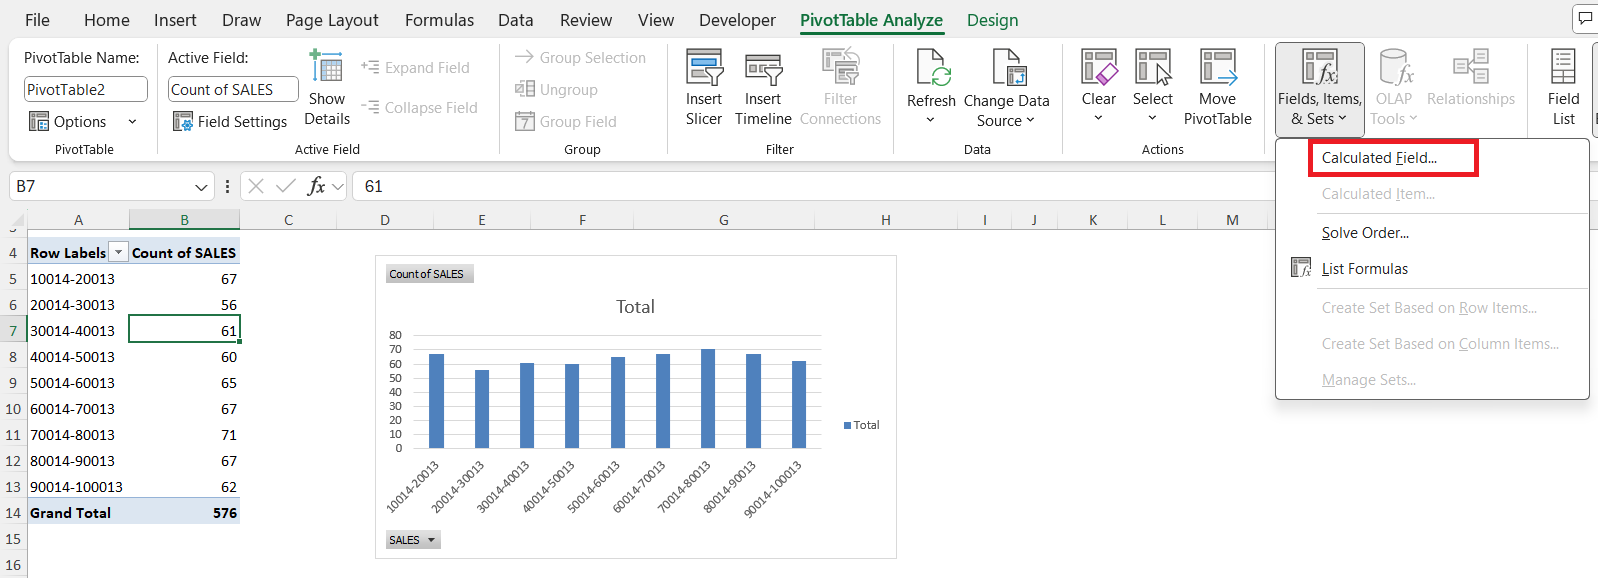
- I use calculated fields for custom formulas right within the pivot table.
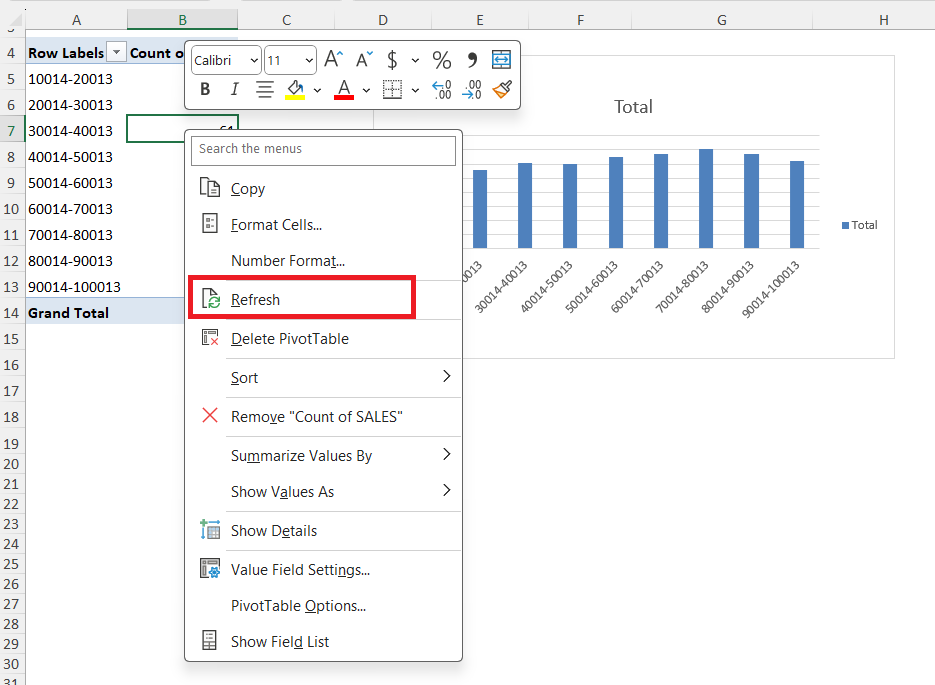
- Whenever my source data changes, I right-click the pivot table and refresh it.
‘
FAQs
What are Field Settings in a Pivot Table?
Field Settings control the name, subtotals, and layout of row and column fields.
What is the difference between Value Field Settings and Show Values As?
Value Field Settings control how data is summarized in the pivot table. Show Values As, on the other hand, determines how the results are displayed.
Can I use more than one calculation for the same field in a Pivot Table?
Yes! I frequently add the same data field multiple times to the Values area, then change the Value Field Settings for each. For instance, I can display both the total and the average for a sales column, or compare counts and sums side by side for deeper insight.
How to display values as percentages in my pivot table?
To show values as percentages,
- Right-click on the value
- Select Show Values As
- Choose ‘% of Grand Total,’ ‘% of Row Total,’ or ‘% of Column Total’
What to do if my pivot table doesn’t update when source data changes?
Whenever I change the underlying data, my pivot table doesn’t refresh automatically. To fix it,
- Right-click anywhere inside the pivot table
- Choose Refresh

Bryan
Bryan Hong is an IT Software Developer for more than 10 years and has the following certifications: Microsoft Certified Professional Developer (MCPD): Web Developer, Microsoft Certified Technology Specialist (MCTS): Windows Applications, Microsoft Certified Systems Engineer (MCSE) and Microsoft Certified Systems Administrator (MCSA).
He is also an Amazon #1 bestselling author of 4 Microsoft Excel books and a teacher of Microsoft Excel & Office at the MyExecelOnline Academy Online Course.

 30 Days - Full Access