Understanding your break-even point is essential for making informed business decisions. Whether you’re launching a new product, assessing profitability, or managing budgets, calculating this point in Excel can help you visualize your financial thresholds. This guide will walk you through everything you need to know about setting up a break-even point calculator using basic Excel formulas.
Key Takeaways
- Learn the basic formula for calculating break-even point in units and revenue.
- Set up a dynamic Excel worksheet for real-time break-even analysis.
- Incorporate variable and fixed cost inputs to automate your calculations.
- Visualize the break-even point using Excel’s built-in chart tools.
- Explore bonus techniques like using Goal Seek and VBA for advanced analysis.
Table of Contents
Understanding Break-Even Analysis
Break-even analysis is a core financial tool that helps businesses determine the point at which total revenue equals total costs. This is known as the break-even point, and it tells you how many units of a product or service you need to sell to cover your costs. Any sales beyond this point contribute to profit.
In Excel, break-even analysis is easy to implement and flexible enough to update as your assumptions change. Whether you’re a small business owner, a finance manager, or just exploring pricing strategies, knowing how to calculate break-even can help you make better decisions.
The break-even point can be calculated using the formula:
Let’s break this down:
Fixed Costs are costs that remain constant regardless of how many units you produce or sell. Examples include rent, salaries, and insurance.
Variable Costs are costs that change with the level of production or sales, such as materials or shipping.
Selling Price per Unit is how much you charge customers per product.
By understanding and calculating your break-even point, you can answer questions like:
How many products must I sell to avoid a loss?
If I increase my prices, how does that impact profitability?
What happens if my variable costs rise?
With Excel, you can build a model once, then tweak it whenever your business conditions shift—saving you time and helping you respond confidently.
Step-by-Step Guide to Calculate Break-Even Point in Excel
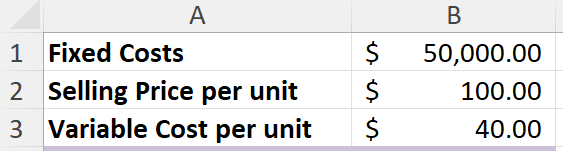
Step 1: Input Your Data
In a blank Excel sheet, enter your core variables:
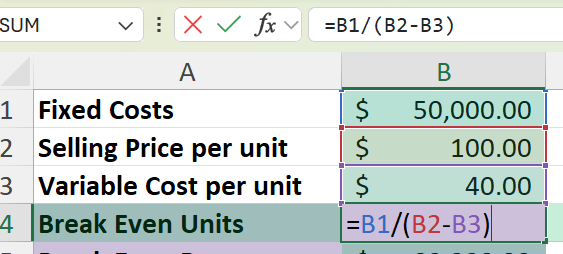
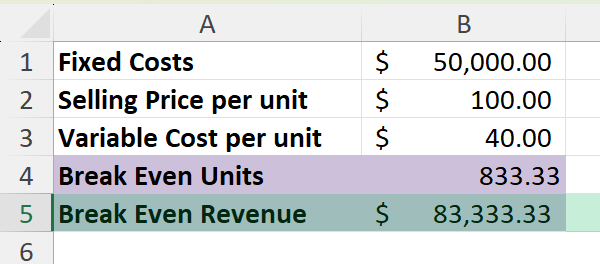
Step 2: Calculate Break-Even Units
In cell B4, use the formula:
=B1 / (B2 - B3)
This gives you the number of units required to break even.
Step 3: Calculate Break-Even Revenue
In cell B5, use:
=B4 * B2
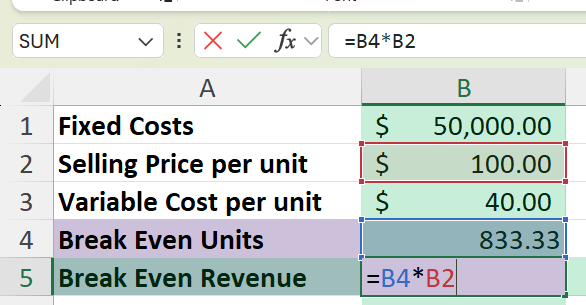
This gives the total revenue needed to break even.
Common Mistakes and Tips
Incorrect formula structure: Ensure you use correct cell references and arithmetic when calculating profit. Mistakes in order of operations can lead to incorrect outcomes.
Using inconsistent units: Keep all units (e.g. currency, quantities) consistent. For example, don’t mix dollars and euros without clear conversion.
Forgetting to include fixed costs: Many users mistakenly ignore fixed costs in break-even calculations, skewing results significantly.
Overwriting formulas with hard-coded values: This makes future updates harder and more error-prone. Always keep your formulas intact for flexibility.
Not using absolute references in Excel formulas: When copying formulas across rows or columns, remember to lock fixed values like fixed costs using dollar signs (e.g., $B$2).
Bonus Tips and Advanced Scenarios
Use Data Tables to model different sales scenarios: Create a one-variable data table where unit sales change across a range. This lets you visualize how revenue and profit vary.
Automate with Excel VBA: Use a macro to recalculate break-even based on changing inputs. For example, you can build a macro that prompts for variable cost, fixed cost, and selling price, then calculates the break-even point.
Use Power Query for dynamic data sources: Import cost and price data from external sources (like CSV or web links) and clean it using Power Query. This helps in managing frequently changing data.
Plot Break-Even Graph: Insert a chart plotting Total Revenue and Total Cost across units sold. This gives a visual intersection point for break-even.
Scenario Manager: Use Excel’s built-in Scenario Manager to evaluate different business strategies by toggling between variable pricing and cost models.
Frequently Asked Questions
Can I use Excel to compare multiple product lines?
Yes. Create separate break-even tables for each product and use summary sheets to consolidate insights.
How do I factor in taxes?
Add a new row to your cost structure to account for taxes and include it in total costs.
What chart type is best for break-even analysis?
A line chart showing Total Cost and Total Revenue is ideal.
Can I use Excel’s Solver for break-even?
Yes. Solver can handle more complex scenarios involving constraints and multiple variables.
Does the formula work with decimal costs?
Yes. Excel handles decimal precision, so costs like 0.25/unit are supported.
Summary
With Excel, calculating your break-even point becomes straightforward and dynamic. By using formulas, charts, and tools like Goal Seek or VBA, you can analyze and adapt your financial plans efficiently. The downloadable workbook included below provides all formulas, data, and visuals discussed here, so you can get started right away.

John Michaloudis is a former accountant and finance analyst at General Electric, a Microsoft MVP since 2020, an Amazon #1 bestselling author of 4 Microsoft Excel books and teacher of Microsoft Excel & Office over at his flagship MyExcelOnline Academy Online Course.


