If you wish to answer one fundamental question: Are there any statistically significant differences between the means of different groups? ANOVA analysis is your answer.
In this article, we will cover the following topics –
Download the Excel Workbook below to follow along and understand how to use ANOVA in Excel – download excel workbookANOVA-in-Excel.xlsx
Introduction to ANOVA
ANOVA in Excel is a statistical method that is used to test the difference between two or more means. ANOVA operates as a means to test the validity of the null hypothesis i.e. the mean of the samples are not significantly different.
There are two types of ANOVA –
- One-way ANOVA uses one independent variable.
- Two-way ANOVA uses two independent variables
ANOVA Analysis is a powerful tool used in various fields like economics, finance, healthcare, insurance, etc to check if there is any statistically significant differences between the mean of different groups.
There are two types of hypothesis –
- Null Hypothesis (H0) – It claims that all the population values are exactly equal to each other. There is no statistically significant difference between the means of the groups. H0: μ1 = μ2 = μ3
- Alternative Hypothesis (H1) – It claims that atleast one of the value is different from other values i.e. there is statistically siginificant difference between the means of the groups.
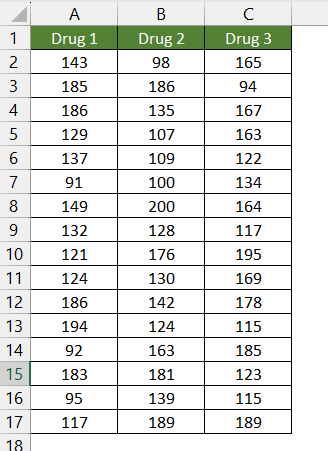
For example, ANOVA can be used to test the effectiveness of three different drug formulations (A, B, and C) to reduce blood sugar levels. We will check if there is any difference between the 3 formulations or if not using ANOVA in Excel.
- Null Hypothesis – All the drug formulations provide the same result.
- Alternative Hypothesis – At least one drug provide different results than the others.
Once we get the output from Excel, we need to compare F-value with F-critical. In general, if your calculated F value in a test is larger than your F critical value, you can reject the null hypothesis.
Conduct ANOVA in Excel
Follow the steps below to understand how to use ANOVA in Excel –
Before we start, go to Data Tab in Excel Ribbon and look for Data Analysis. If not found, follow the steps below to install it. Otherwise, you can go to STEP 3 directly.
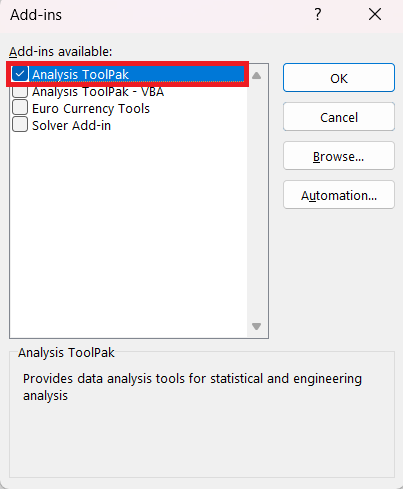
STEP 1: Go to Search Bar and type Add-Ins.
STEP 2: Select Analysis ToolPak and Click OK.
STEP 3: Go to Data Tab > Data Analysis.
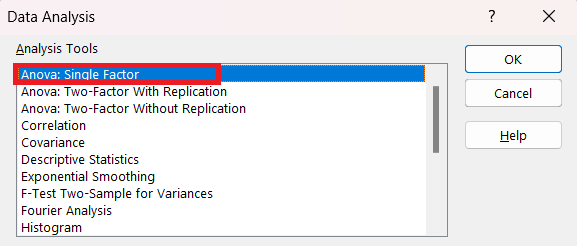
STEP 4: In the Data Analysis dialog box, select ANOVA: Single Factor and click OK.
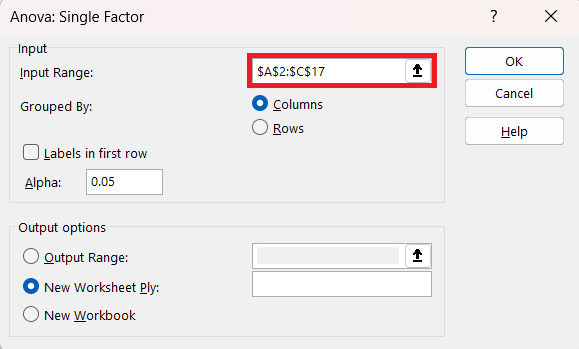
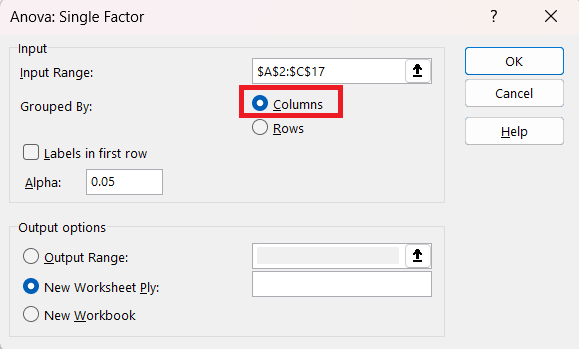
STEP 5: Enter the input range i.e. A2:C17.
STEP 6: Select Group by as Columns as the different drugs are mentioned in different columns.
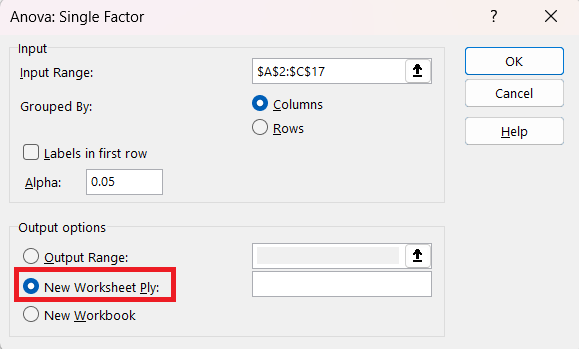
STEP 7: Select Output Options as New Worksheet ply.
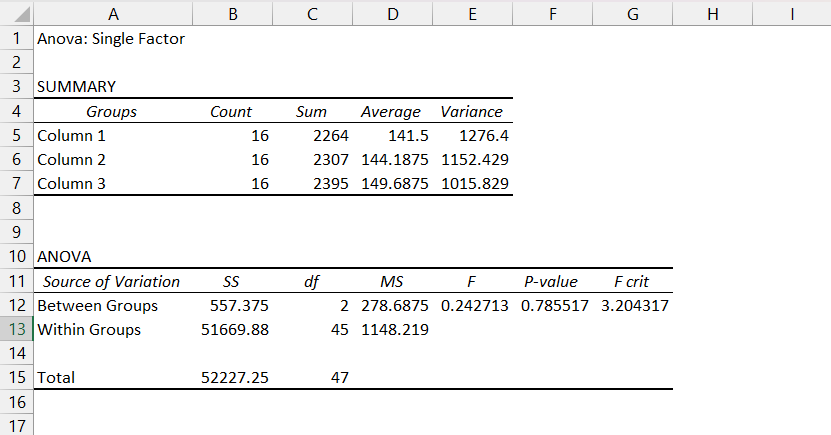
The output will then be displayed in a new worksheet.
Interpretation of Results
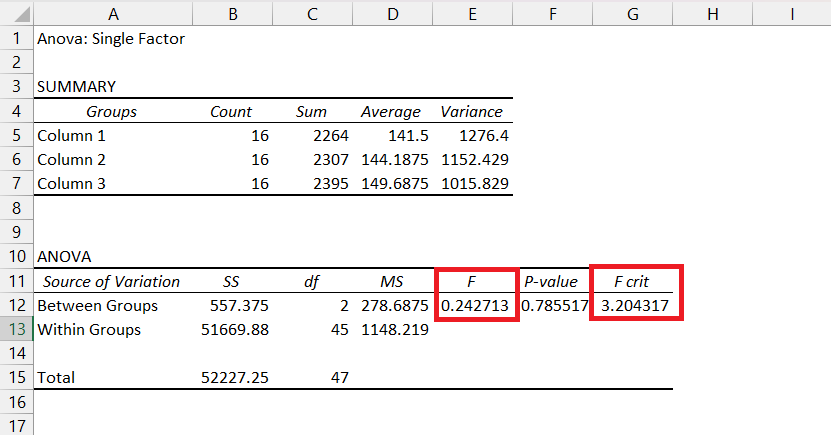
When determining whether to accept or reject the null hypothesis, the F statistic becomes a crucial tool. Within your F test outcomes, you will encounter both an F value and an F critical value.
- The computed value derived from your dataset is referred to as the F Statistic or F value. Here, it is 0.242.
- The distinct benchmark against which you assess your F value is the F-critical. Here, it is 3.2.
As F <F-critical, we cannot reject the null hypothesis i.e. all three drugs are producing the same result and are not significantly different from each other.
Conclusion
ANOVA, or Analysis of Variance, is a statistical test within Microsoft Excel used to analyze variances in datasets. The process of conducting ANOVA in Excel is outlined in this article, involving steps such as installing the Analysis ToolPak, conducting the ANOVA test, and interpreting the results.
ANOVA involves testing a null hypothesis that assumes no significant difference between group means (H0: μ1 = μ2 = μ3…). The alternative hypothesis (H1) suggests that at least one group mean differs from the others.
Click here to learn all about complex data analysis in Excel.
John Michaloudis is a former accountant and finance analyst at General Electric, a Microsoft MVP since 2020, an Amazon #1 bestselling author of 4 Microsoft Excel books and teacher of Microsoft Excel & Office over at his flagship MyExcelOnline Academy Online Course.

