The 50/30/20 rule serves as a straightforward guideline for managing personal finances, allowing us to allocate income efficiently. This rule divides after-tax income into three categories: 50% for needs, 30% for wants, and 20% for savings or debt repayment. As someone looking to breakdown dollar amount into 50/30/20, I’ve found using Excel to be a powerful tool. Here, I’ll share how to set up and use an Excel spreadsheet to help automate and simplify this financial strategy.
Key Takeaways:
- The 50/30/20 rule simplifies budgeting by dividing after-tax income into needs, wants, and savings.
- Excel is a powerful tool to automate the rules, reduce manual effort, and increase accuracy.
- Conditional formatting flags overspending, giving you instant visual cues when your actuals go off track.
- Using formulas like =Income * 0.50 automates your budget breakdown with minimal setup.
- Custom tweaks like charts, subcategories, and trend tracking make your spreadsheet more insightful and useful over time.
Table of Contents
Understanding the 50/30/20 Rule
Origins and Purpose
The 50/30/20 rule offers a simple structure to help individuals manage their finances without the complexities of traditional budgeting methods. When I first heard about the 50/30/20 budgeting rule, it felt like a breath of fresh air. Simple, practical, and flexible enough to fit my lifestyle. The rule goes like this:
- 50% of your income goes to Needs (rent, bills, groceries)
- 30% goes to Wants (entertainment, dining out, travel)
- 20% goes to Savings (investments, debt repayment, emergency fund)
But like everything else, I wanted this system in Excel—my go-to place for organizing financial chaos. So here’s exactly how I set up a spreadsheet to break down any dollar amount (monthly income, bonus, freelance payment—you name it) using the 50/30/20 rule.
This rule aims to ensure basic necessities are covered, enjoyments are kept within limits, and savings and debt repayments are prioritized. By doing so, we can achieve a balanced financial plan that supports long-term stability and flexibility.
Advantages of Applying the Rule
Applying the 50/30/20 rule provides several advantages that make it appealing. Its simplicity is a key benefit, allowing even new budgeters like myself to easily categorize expenses and income. It also fosters a disciplined savings habit by earmarking a specific portion of income for savings or debt reduction, which can lead to improved financial health over time.
Additionally, the rule provides flexibility for us to enjoy discretionary spending, preventing budget burnout. By following this rule, we can achieve a sustainable balance between immediate financial requirements and future goals.
Breakdown Dollar Amount into 50/30/20
Setting Up the Basic Structure
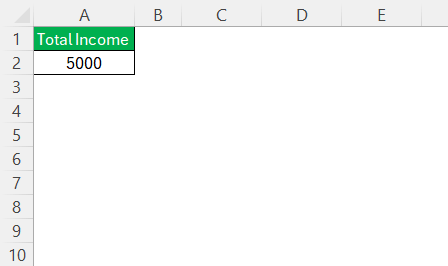
Creating a 50/30/20 budget in Excel begins with setting up a clear structure. First, I input my total monthly after-tax income at the top of the sheet.
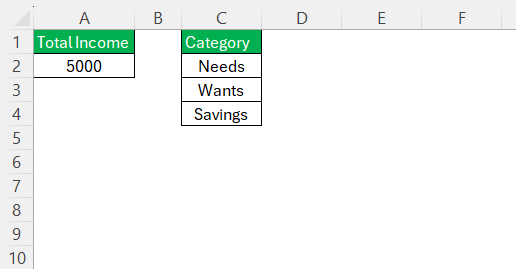
After this, I allocate sections under each category: Needs, Wants, and Savings.
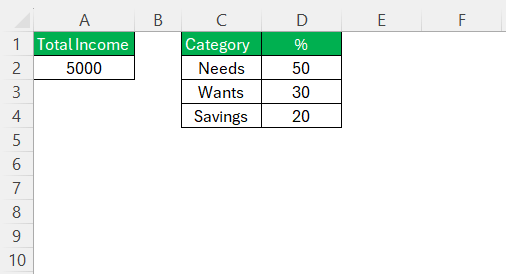
I will then input the corresponding percentage next to each category.
This organized setup allows me to see all financial categories at a glance, ensuring nothing is overlooked.
Automating Calculations
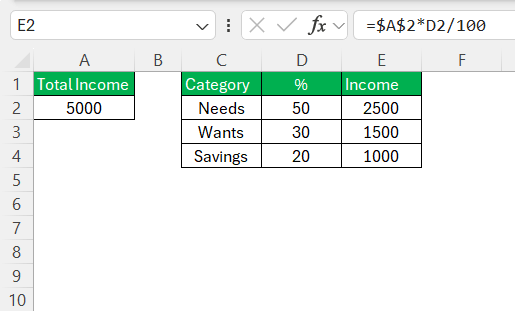
Automating calculations in Excel significantly streamlines the budgeting process, reducing manual errors and saving time. To do this, I utilize simple formulas. I multiply the total income with percentage for each category.
This will distribute the dollar amount into 50/30/20.
Highlight Deviations from 50/30/20 Using Conditional Formatting
To stay honest with my budget, I don’t just plan my spending—I track how well I actually stick to it. I use conditional formatting in Excel to instantly highlight where I’m overspending or underspending compared to my 50/30/20 plan. It’s quick, visual, and brutally honest (in the best way).
Here’s how the math works behind the scenes:
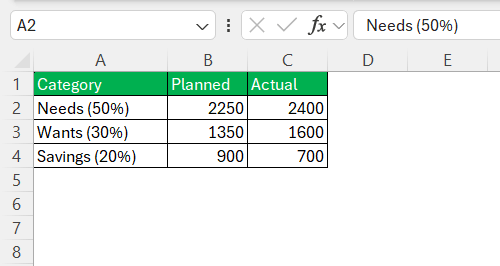
STEP 1: In column B, enter the planned amount, and in column C, enter the actual amount you spent on each category.
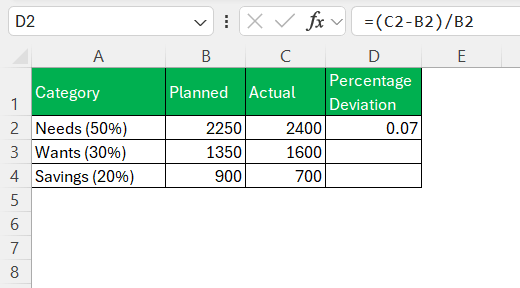
STEP 2: In cell D2, enter the formula to calculate percentage deviation.
=(C2-B2)/B2
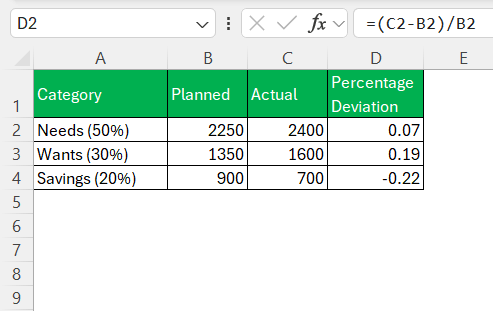
STEP 3: Drag this down to D4.
This will show you how much each actual spend deviates (in % terms) from your target.
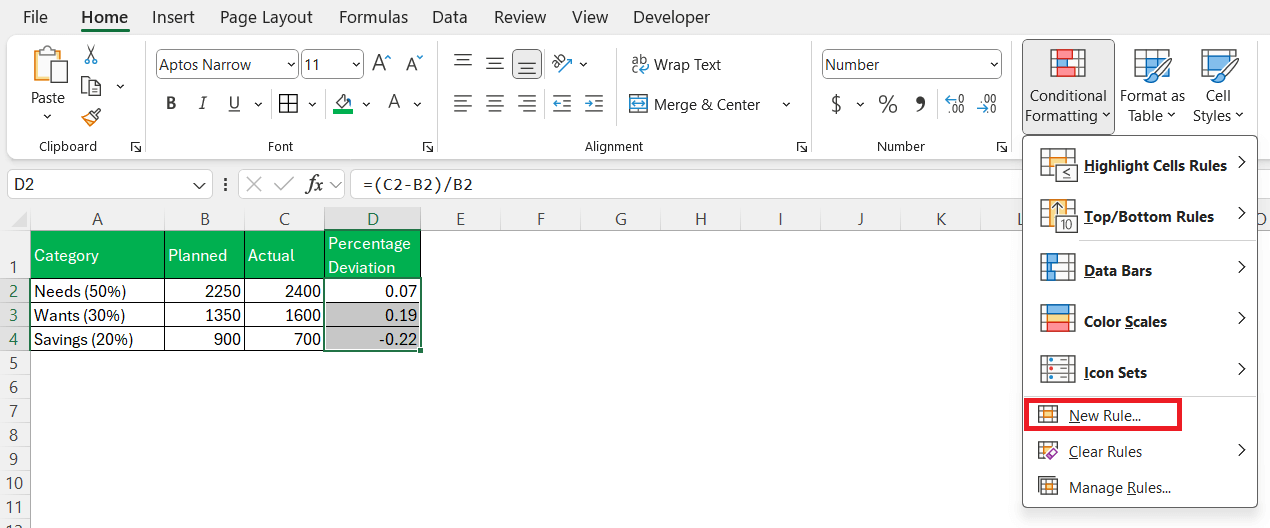
STEP 4: Select cells D2 to D4 and go to Home > Conditional Formatting > New Rule.
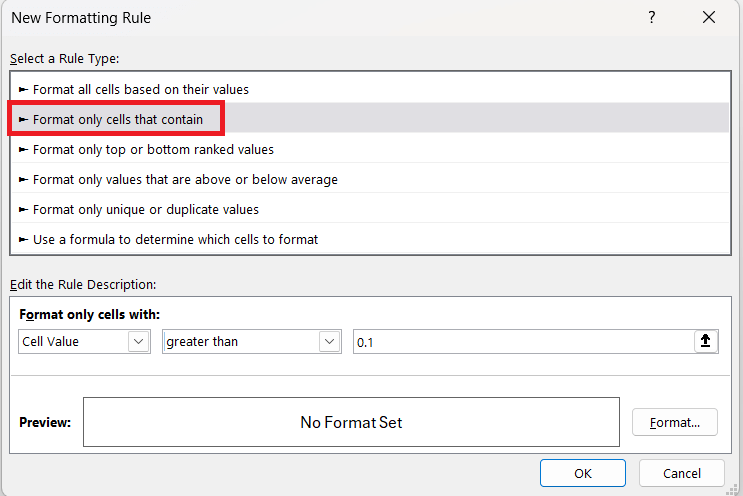
STEP 5: Choose “Format only cells that contain” and under “Format only cells with”, choose:
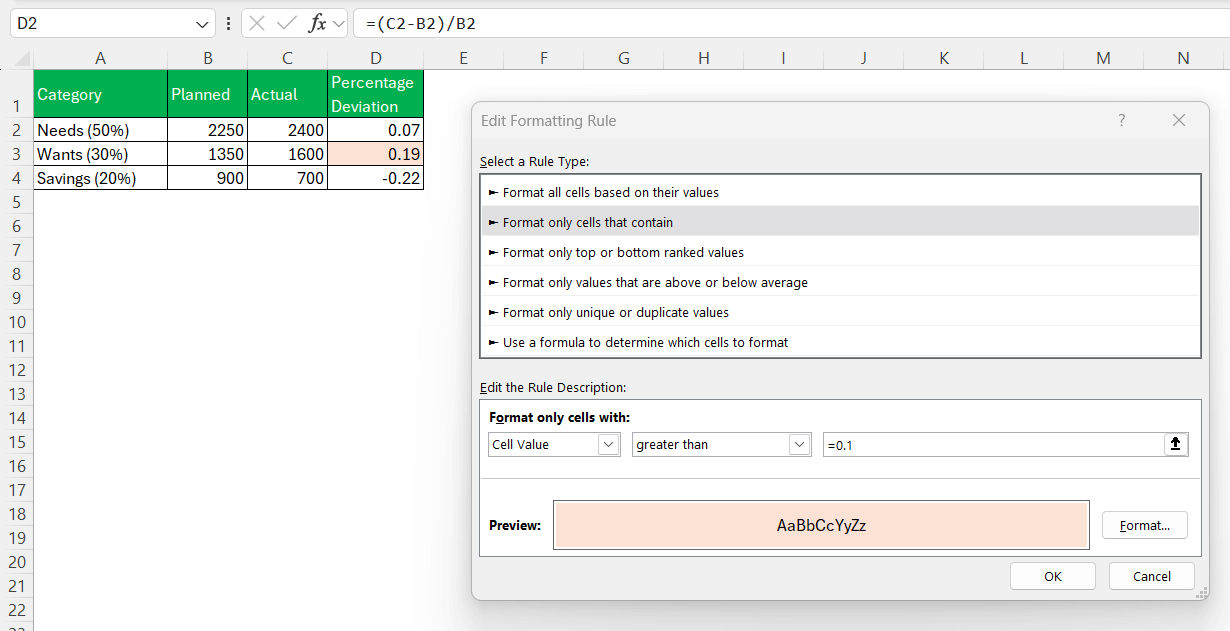
Cell Value; greater than; Enter 0.1 (for 10% deviation)
STEP 6: Click Format, pick a red fill, and hit OK.
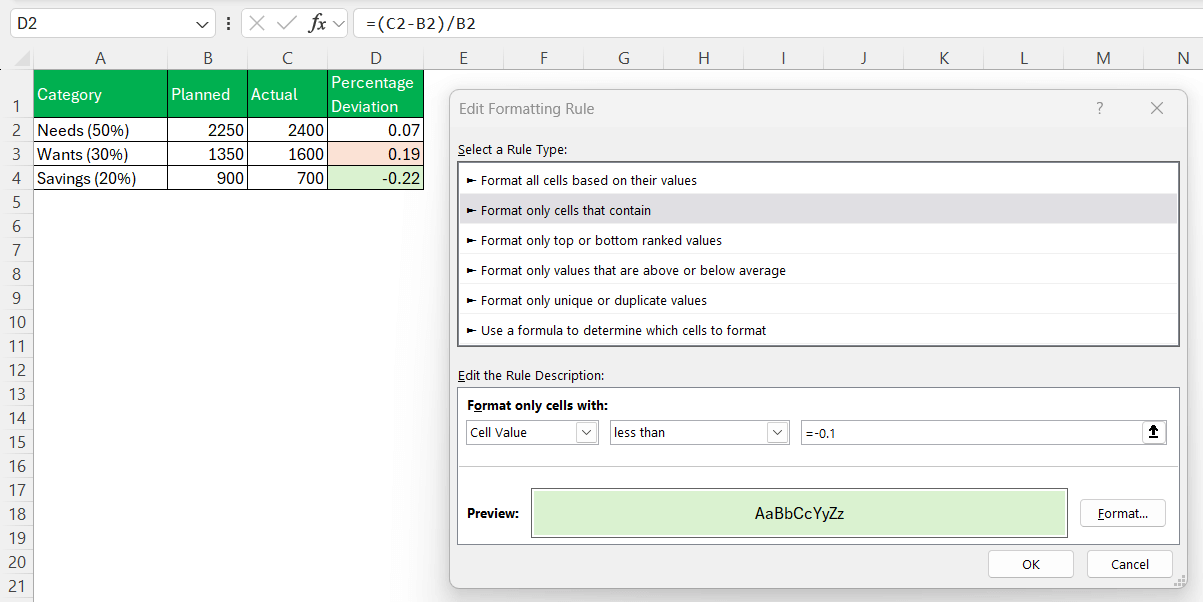
STEP 7: Repeat the above to highlight under-spending. Set the condition to less than -0.1 and choose a green fill.
Now, every time I overspend or underspend by more than 10%, Excel gives me a visual nudge. It’s like having a personal budgeting assistant who only yells in color.
Tips & Tricks
- Use Named Ranges: Instead of
B1, I name itTotal_Income—makes formulas easier to read.
- Add Monthly Variations: Use drop-downs to switch between months or income types.
- Use Charts: A pie chart makes it way easier to visualize how your money is split.
- Add Subcategories: Break “Needs” into rent, utilities, transport, etc., for more granular control.
- Track Trends: Use a separate sheet to compare month-to-month patterns and progress.
FAQs
What makes the 50/30/20 rule so effective compared to other budgeting methods?
The 50/30/20 rule stands out because of its simplicity and flexibility. Unlike rigid budgets that require tracking every transaction, this method focuses on broad categories that are easy to manage. It balances financial discipline (through savings) with realistic freedom (through wants), which helps prevent burnout. I found it easier to stick to this rule because it doesn’t feel restrictive—it’s sustainable.
How do I adjust the 50/30/20 rule if my income varies month to month?
If you have a variable income (like me during freelance-heavy months), just update the total income cell in Excel each month. Since the formulas are based on percentages, the rest of the spreadsheet recalculates automatically. You’ll still maintain the same proportions, even if the actual dollar amounts change. It keeps the structure intact while allowing for flexibility.
Can I include debt repayment under both Needs and Savings?
That depends on the type of debt. Minimum payments on things like student loans or credit cards often fall under Needs since they’re mandatory. Extra payments toward principal or aggressive payoff strategies can go under Savings. Personally, I split it: the base payment under Needs, and any overage as part of my 20% Savings/Debt payoff bucket.
What if my expenses don’t align with the 50/30/20 split?
Don’t worry—it’s a guideline, not a commandment. If your Needs are more than 50%, that’s common in high-rent cities. The key is to try and rebalance over time by reducing unnecessary Wants or increasing income. I sometimes shift my Wants or Savings temporarily to cover shortfalls, but always track it so I’m aware and can course-correct later.
How can I make my 50/30/20 spreadsheet more interactive or dynamic?
A few Excel tricks can elevate your spreadsheet:
- Use named ranges to keep formulas readable
- Add drop-downs to switch between months
- Insert pie charts for a visual breakdown
- Use conditional formatting to flag deviations
- Add a summary dashboard for trends across months
These touches make budgeting less boring and way more insightful.
John Michaloudis is a former accountant and finance analyst at General Electric, a Microsoft MVP since 2020, an Amazon #1 bestselling author of 4 Microsoft Excel books and teacher of Microsoft Excel & Office over at his flagship MyExcelOnline Academy Online Course.

