Cross multiplication is a method used to solve proportions or compare ratios, such as A/B = C/D. Instead of solving it manually every time, Excel can handle these calculations with ease using formulas. Whether you’re working with unit conversions, financial models, or educational templates, cross multiplication in Excel can simplify your workflow.
Key Takeaways
- Cross multiplication in Excel can solve proportions such as A/B = C/D using simple formulas.
- Use multiplication and division formulas to automate proportional relationships.
- Helpful for solving missing values in ratios and fractions.
- Can be enhanced using IFERROR, named ranges, or VBA for more control.
- Use helper columns for better clarity and traceability of steps.
Table of Contents
Understanding Cross Multiplication
Cross multiplication solves proportions where two ratios are set equal. The general form is:
A / B = C / D
Cross multiplying gives:
A * D = B * C
If one of the variables is missing, you can isolate and solve for it using a rearranged formula. Excel allows you to do this using basic arithmetic operations.
Practical Applications in Spreadsheets
Cross multiplication in Excel offers practical solutions in many real-world scenarios. It’s commonly used for converting units, scaling models, and computing currency exchanges. Suppose you have a table with different currencies’ exchange rates; to find how much 50 USD is in Euros, cross multiplication can quickly compute this. Another practical application is in data analysis, where you can compare trends across datasets using cross multiplication to maintain proportionality and accuracy. In financial spreadsheets, this technique can help in calculating loan interests or investment returns by cross-referencing different scenarios to arrive at correct insights. Implementing cross multiplication in spreadsheets can be enhanced through simple Excel functions like PRODUCT or using cell references to streamline the process.
Step-by-Step: Cross Multiplication Formula in Excel
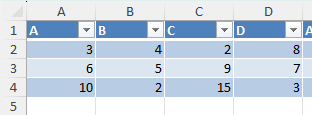
Step 1: Prepare Your Data
Let’s assume we want to solve for a missing value in the equation A / B = C / D. Set up your worksheet like this:
Step 2: Apply the Cross Multiplication Formula
We know from cross multiplication:
A * D = B * C => D = (B * C) / A
In cell D2, enter this formula:
= (B2 * C2) / A2
This will return the correct value of D that satisfies the proportion.
Step 3: Solve for Other Missing Variables
To solve for a different missing variable, rearrange the formula. For example:
To solve for A: = (B2 * C2) / D2
To solve for B: = (A2 * D2) / C2
To solve for C: = (A2 * D2) / B2
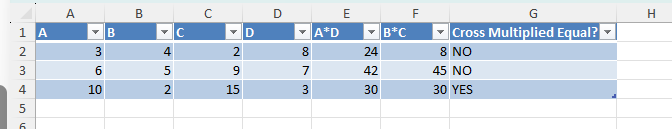
Step 4: Quick Check
Now we can do a quick check by setting these up:
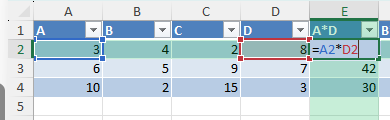
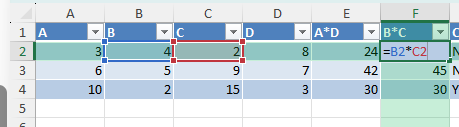
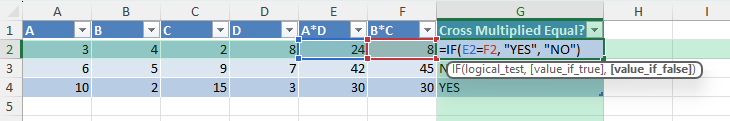
In the end we have this formula to compare if the calculation is correct:
=IF(E2=F2, “YES”, “NO”)
Common Mistakes or Tips
Division by Zero: Always check that your denominator is not zero.
Cell References: Ensure you are referencing the correct cells, especially when copying formulas across rows.
Data Types: Ensure values are numeric. Text values will result in errors.
Blank Cells: Use IF or IFERROR to manage missing inputs.
Hardcoding vs Cell Reference: Use cell references instead of fixed numbers for flexibility.
Bonus Tips and Advanced Techniques
Use Named Ranges
Name the cells (e.g., A = A_cell, B = B_cell) and use:
= (B_cell * C_cell) / A_cell
Apply Data Validation
Restrict inputs to numeric values using Excel’s Data Validation feature.
Automate with VBA
You can write a macro to automatically calculate the missing value:
Sub CrossMultiply()
    Dim A As Double, B As Double, C As Double
    A = Range("A2").Value
    B = Range("B2").Value
    C = Range("C2").Value
    If A <> 0 Then
        Range("D2").Value = (B * C) / A
    End If
End Sub
Creating Charts from Cross Multiplication Data
Visualizing data derived from cross multiplication through charts provides clearer insights and facilitates better decision-making. Charts effectively transform raw data into visual formats that highlight trends, make comparisons, or reveal patterns. In Excel, once you’ve completed your cross multiplication calculations, you can easily convert the results into various chart types, like bar or line charts.
To create a chart, first, ensure your cross-multiplied data is organized in an understandable format, with clear labels for each axis. Then, select your data range and head to the ‘Insert’ tab to choose the appropriate chart type. For instance, a line chart might be ideal for tracking changes over time, while a bar chart could better illustrate comparative volumes. Utilizing charts not only aids in simplifying complex datasets but also enhances the presentation of your findings, useful in reports or meetings. Always remember to add labels and legends to make your charts interpretable at a glance.
Data Validation and Verification
Data validation and verification are crucial steps in ensuring the accuracy and reliability of results obtained from cross multiplication in Excel. Data validation restricts the type of data or the values that users enter into a cell, thereby preventing errors before they occur. To set up data validation, navigate to the ‘Data’ tab, select ‘Data Validation’, and define the criteria your data must meet—such as restricting entries to numbers within a specified range. This helps maintain data integrity, especially in large datasets where cross multiplication will be performed.
Verification, on the other hand, involves checking the results of your calculations to ensure accuracy. One approach is reconciling your calculated results with a known dataset or conducting a manual check on key figures to confirm that the cross multiplication logic has been correctly applied. Leveraging Excel’s built-in features, such as ERROR.TYPE, can also help identify and resolve common issues like division errors. Regular auditing of your spreadsheets, with attention to formula errors or anomalies, ensures that your data remains consistent and dependable.
Frequently Asked Questions
What is cross multiplication used for in Excel?
It helps solve equations where two ratios are set equal and one variable is unknown. Excel formulas make it easy to calculate the missing value.
Can I use cross multiplication for currency conversions?
Yes, as long as the relationship between the two currencies is proportional. You can set up your rates and use cross multiplication accordingly.
What happens if a value is zero?
If the value is in the denominator, it causes a #DIV/0! error. Always use IFERROR to catch these issues.
Can I automate cross multiplication using VBA?
Yes. You can write macros to handle repetitive calculations or apply them across large datasets.
Is there a built-in function for cross multiplication?
No built-in function, but Excel’s basic arithmetic operators allow you to perform cross multiplication easily using formulas.

John Michaloudis is a former accountant and finance analyst at General Electric, a Microsoft MVP since 2020, an Amazon #1 bestselling author of 4 Microsoft Excel books and teacher of Microsoft Excel & Office over at his flagship MyExcelOnline Academy Online Course.


