Whether you are working on marketing data, website analytics, or ad performance, calculating CTR is a key skill. Excel is a powerful tool that can be used to calculate and analyze CTR efficiently. In this article, you will learn how to calculate CTR formula in Excel.
Key Takeaways:
- CTR shows how many people click after seeing your ad.
- You can calculate CTR in Excel using a simple formula.
- Clean and organized data makes CTR calculation easier.
- Tools like PivotTables help you analyze CTR better.
- Use CTR insights to improve ads and increase performance.
Table of Contents
Understanding CTR
Click-Through Rate, often abbreviated as CTR, is a term that is very common in digital advertising analytics. It serves as a barometer for the effectiveness of online ads and campaigns. It is a metric that is used to calculate the number of clicks your ad receives relative to the number of times it’s been shown. You can gauge how well it captivates your audience.
CTR = (Number of Clicks / Number of Impressions) × 100
A higher CTR indicates that viewers find your ad appealing enough to take the leap and click through.
How to Calculate CTR in Excel
Setting Up Your Excel for CTR Formula
Make sure that your data is organized properly in the spreadsheet. The columns must be clearly labeled for clicks, impressions, and any other relevant metrics.

- Right-click on numerical values like clicks and impressions.
- Select Format Cells.
- In the dialog box, select Number.

Next, I familiarize myself with the PivotTable functionality, as it will be useful in summarizing data.
Essential Formulas to Calculate CTR
Calculating CTR in Excel is a key skill that is useful for gauging ad performance. The formula for CTR is the total number of clicks divided by the total number of impressions, usually multiplied by 100.
=(Clicks/Impressions)*100

You can also create a calculated field in a pivot table to get ‘True CTR’.
- Go to the Insert > Pivot table.
- Go to PivotTable Analyze > Fields, Items & Sets > Calculated Field.

- Label it as ‘True CTR’ with the formula
= Clicks/Impressions.

- Change the format to Percentage.

Advanced Techniques
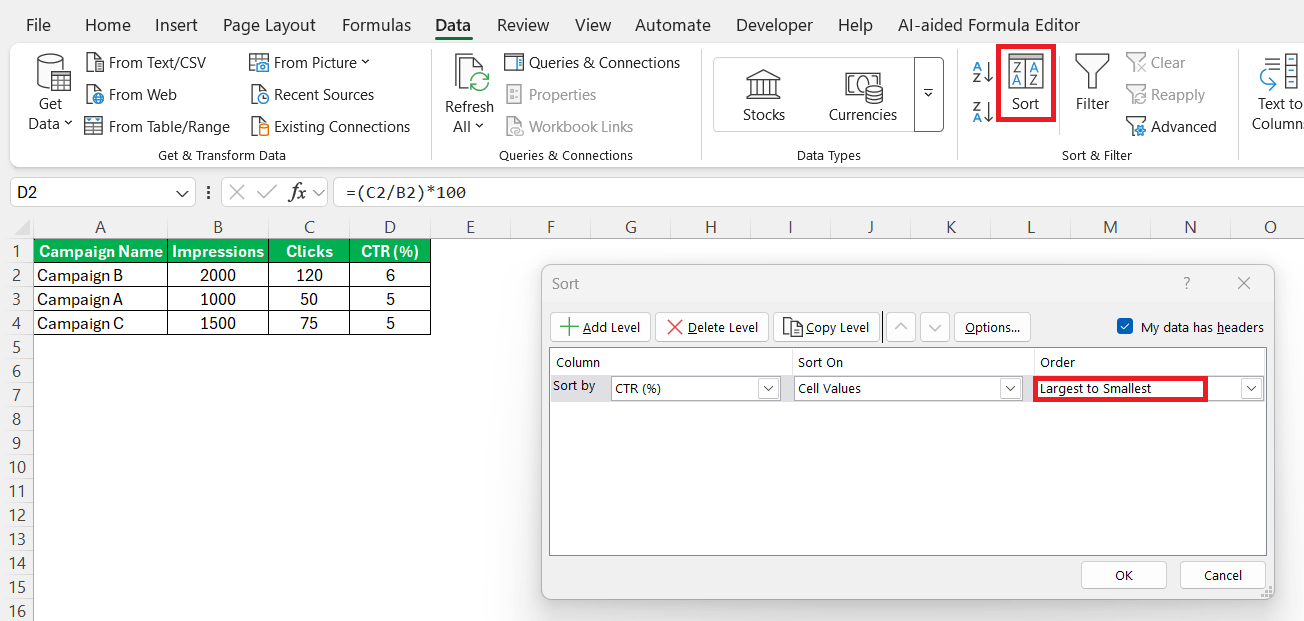
Comparing CTR Across Campaigns
You can sort your data by CTR to identify which campaigns are performing best.
- Select your table.
- Go to Data > Sort.
- Sort by CTR column from largest to smallest.
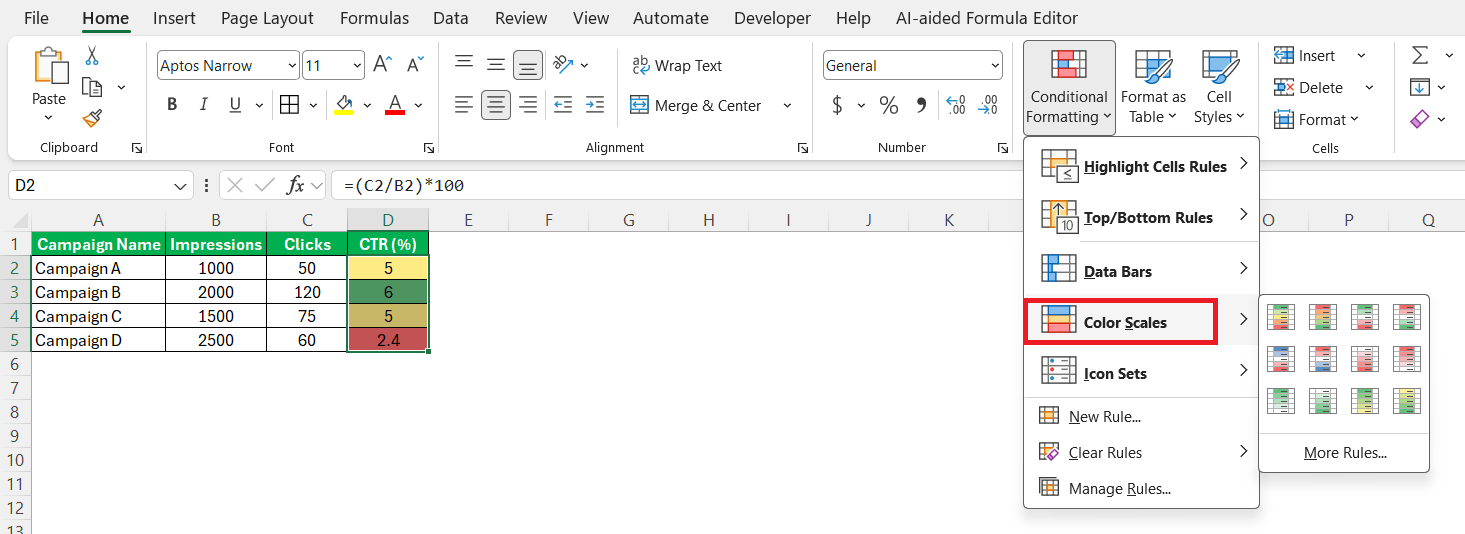
Using Conditional Formatting
Conditional formatting allows you to visually highlight high and low CTR values.
- Select the CTR column.
- Go to Home > Conditional Formatting.
- Choose Color Scales.
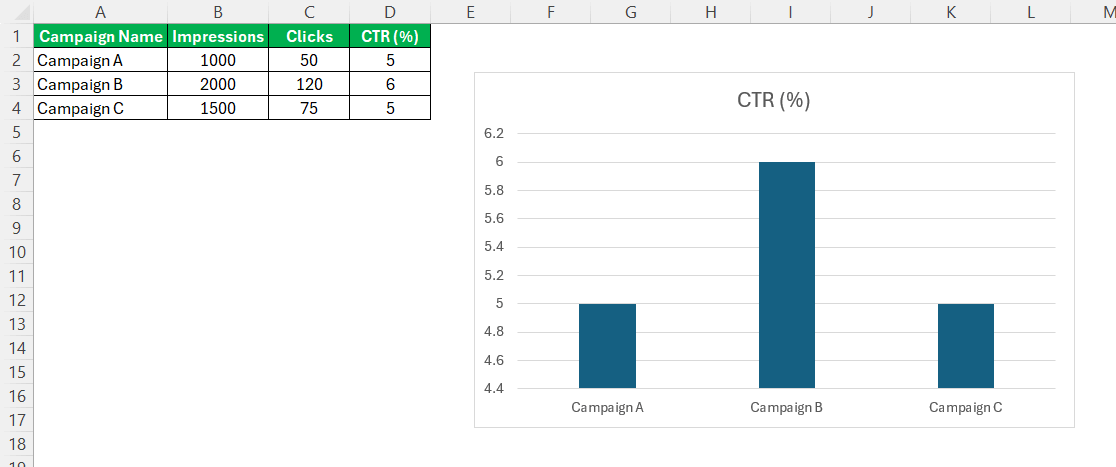
Create Charts for CTR
You can use charts to visualize CTR, which can provide deeper information.
- Select Campaign Name and CTR columns
- Go to Insert > Bar Chart
Measuring Success with Refined Data Insights
Interpreting Results to Drive Higher Engagement
Interpreting CTR results within Excel involves more than just spotting the highs and lows; it’s about understanding the ‘why’ behind the numbers. I start by comparing CTRs against industry benchmarks to assess overall performance. If specific ads have a low CTR, I delve into possible reasons—be it the creative, the targeting, or the offer itself—and test different hypotheses using A/B testing data.
When CTRs are high, I look for patterns that could inform other campaign strategies, like optimal times for ad placements or messaging that resonates with the audience. Further, by correlating CTR with other metrics such as conversion rates and cost per click, I can better understand the customer journey and identify which clicks are truly valuable.
Lastly, I’m always cautious not to over-rely on CTR alone. Engagement is multifaceted, and hence, I also consider other engagement metrics like time on site and page views per visit for a holistic view of campaign effectiveness.
Adjusting Campaign Strategies Based on CTR Findings
CTR findings are a treasure trove of actionable insights. If I observe a trend of declining CTR, this could signal ad fatigue or audience saturation. In response, I recommend refreshing the ad creative or rotating the ad copy to re-engage the viewers. Additionally, we might reassess our targeting criteria to ensure our ads are reaching the most receptive segments.
Conversely, when CTR is consistently high for a particular campaign or ad group, it suggests the messaging resonates well with the target audience. In these situations, we could consider increasing the budget for successful campaigns or applying successful elements—like tone, imagery, or offers—to other campaigns to replicate the success.
Furthermore, I use CTR findings to optimize landing pages and improve overall user experience, thereby bolstering the chances of conversion post-click.
FAQs
What is the formula for CTR?
The formula for calculating Click-Through Rate (CTR) is:
CTR = (Total Clicks ÷ Total Impressions) × 100.
This will let you know the percentage of times a click was made for every impression.
What is ctr in marketing?
CTR in marketing refers to Click-Through Rate. It is a metric that measures the percentage of clicks advertisers receive on their ads relative to the number of times the ad is shown.
How to calculate CTR in Excel?
- Input value for clicks and impressions
- Divide clicks by impressions
- Format the result as a percentage.
Why is CTR important?
It is a useful metric in digital marketing analytics. It helps you understand how well your ads are performing.
How to calculate CTR using PivotTables?
You can create a calculated field to find CTR in PivotTables.

John Michaloudis is a former accountant and finance analyst at General Electric, a Microsoft MVP since 2020, an Amazon #1 bestselling author of 4 Microsoft Excel books and teacher of Microsoft Excel & Office over at his flagship MyExcelOnline Academy Online Course.


