When working with a large dataset, you may need to group data and calculate totals, averages, or counts. This is where the GROUPBY function becomes useful. It helps you organize data and get quick summaries without using multiple formulas. In this article, you will learn what the GROUPBY function is and how it works.
Key Takeaways:
- GROUPBY function can group and summarize data easily.
- It can calculate totals, averages, counts, and more.
- It updates automatically when data changes.
- It can be combined with other Excel functions.
Table of Contents
Introduction to GROUPBY Function
What is the GROUPBY Function?
The GROUPBY function is used to group data using one or more columns. After grouping, it can calculate values for each group.
For example, in sales data, you can group by region and product and then find:
- Total sales
- Average sales
- Number of transactions
- Maximum sales
- Minimum sales
It works like a pivot table. But you need to write formulas here, instead of using menus and buttons. This gives you more control and flexibility.
Why Use GROUPBY?
- It can easily summarize large datasets.
- It reduces manual calculation.
- It replaces the need for multiple formulas with a single formula.
- It updates when data changes.
- It improves accuracy and reduces errors.
How to Use the GROUPBY Function
Syntax
The syntax of the GROUPBY function is:
=GROUPBY(array, by_array, [aggregation], [headers])
- array: Data you want to analyze
- by_array: Columns used to group the data
- aggregation: Calculations like SUM, AVERAGE, COUNT, etc
- headers (optional): Specifies if the data includes headers
Example of GROUPBY
You can use the GROUPBY function to get total sales by region. It groups all the rows based on the region and then adds the sales values for each group.
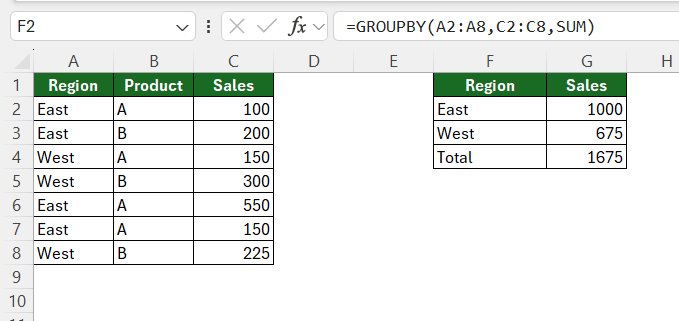
This groups data by region and calculates total sales.
This makes it easier to compare how each region is performing. Instead of scanning the entire dataset, you get a quick summary in a few rows.
Multiple Columns in GROUPBY
You can also group data using more than one column. For example, you can group data by both region and product at the same time.
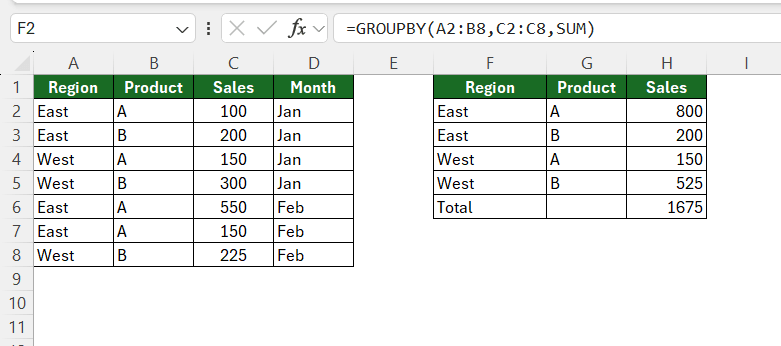
You can see how each product performs in each region instead of just overall totals.
Tips & Tricks
GROUPBY vs PivotTable
- The GROUPBY function uses a formula to get the result. But PivotTable does not need formulas.
- The GROUPBY function updates automatically, but the PivotTable needs a manual refresh to update.
- You can combine other functions with the GROUPBY function.
- PivotTable will be more interactive. You can click a few buttons to change the analysis.
Common Mistakes to Avoid
- Make sure that all ranges have the same number of rows.
- If there are blank cells in the data, the result may be incorrect.
- If your data range changes, update the formula.
- Do not mix text and numbers in the same column
- Use the correct calculation method
FAQs
What does the GROUPBY function do?
It groups data and calculates values like sum, average, or count.
Can I use GROUPBY with multiple columns?
Yes, you can group data using more than one column.
Does the GROUPBY function update automatically?
Yes, it updates when your data changes.
Which is better: GROUPBY or PivotTable?
GROUPBY is good for formulas. PivotTable is better for quick and interactive reports.
What is the syntax of the GROUPBY function?
The syntax is:
=GROUPBY(array, by_array, [aggregation], [headers])

John Michaloudis is a former accountant and finance analyst at General Electric, a Microsoft MVP since 2020, an Amazon #1 bestselling author of 4 Microsoft Excel books and teacher of Microsoft Excel & Office over at his flagship MyExcelOnline Academy Online Course.


