Table of Contents
Data Bars, Color Scales & Icon Sets
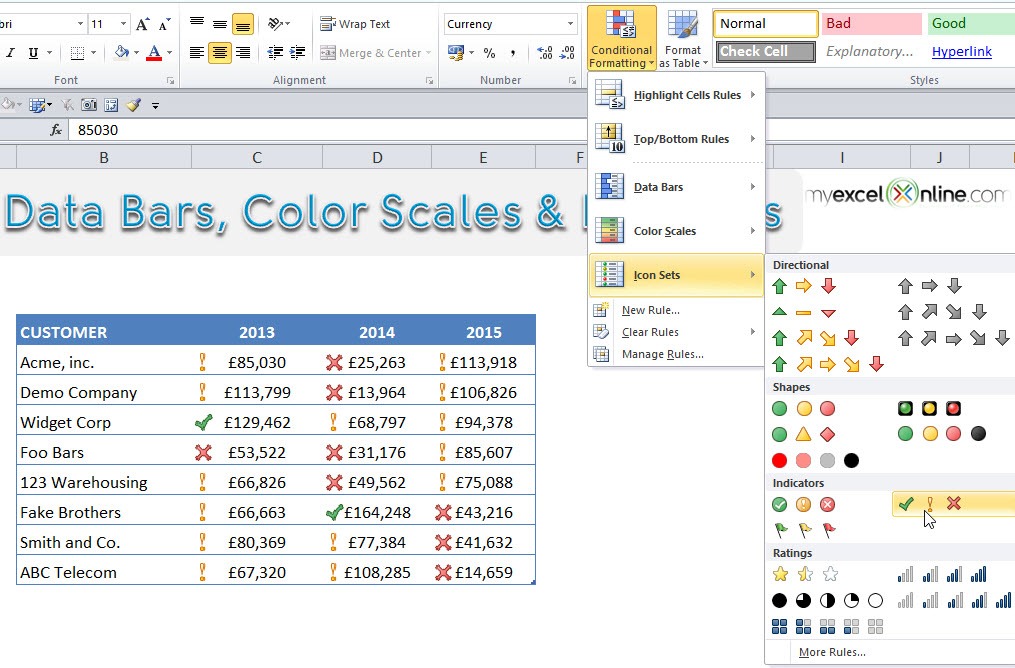
Conditional Formatting has improved in Excel 2010 with the introduction of Data Bars, Color Scales & Icon Sets.
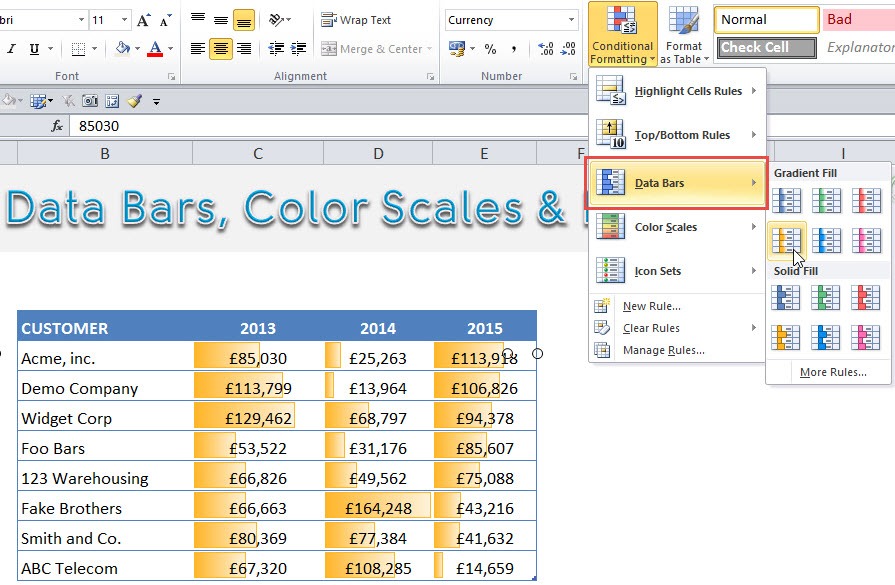
Data Bars: Includes graphic bars in a cell, proportional to the cell’s value – Good for Financial Analysis
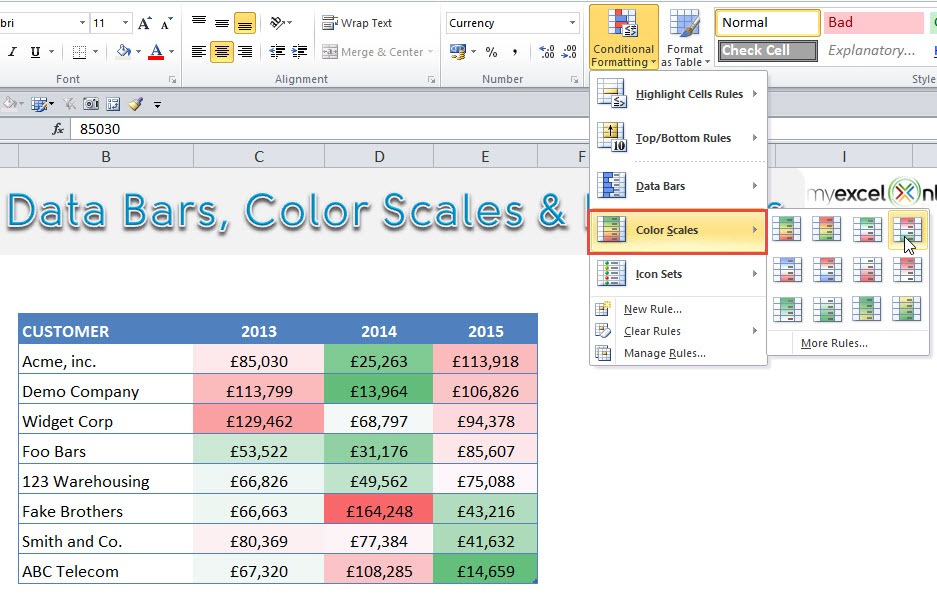
Color Scales: Includes a background color, proportional to the cell’s value – Good for Heat Maps
Icon Sets: Shows icons in a cell. The icons depend on the cell’s value – Good for Project Management reports
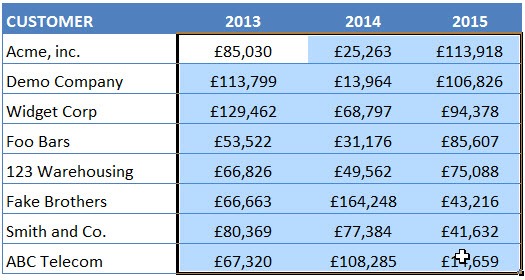
STEP 1: Select the range that you want to apply the conditional formatting on.
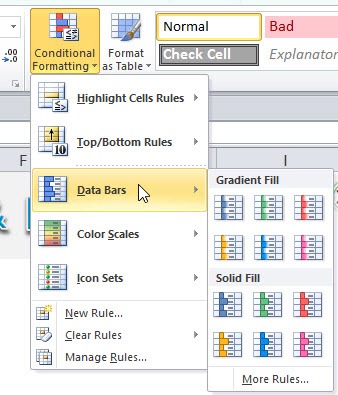
STEP 2: Go to Home > Conditional Formatting
STEP 3: It’s time to have fun! Select a Data Bar, Color Scale, or Icon Set and see what happens!
John Michaloudis is a former accountant and finance analyst at General Electric, a Microsoft MVP since 2020, an Amazon #1 bestselling author of 4 Microsoft Excel books and teacher of Microsoft Excel & Office over at his flagship MyExcelOnline Academy Online Course.

