Working with data in Excel can often feel like navigating a vast ocean of information. Pivot tables offer a way to bring clarity by condensing large datasets into understandable segments. One of the most powerful features of pivot tables is the ability to filter by labels – text. By mastering this skill, we can efficiently organize and analyze our data, ensuring we focus on the most relevant information while discarding the clutter. In this guide, I’ll walk you through the process and highlight some advanced techniques to make your data handling more proficient.
Key Takeaways:
- Label filters help isolate specific text categories in pivot tables.
- Options like “Begins With” or “Ends With” allow targeted data filtering.
- Filtering streamlines reports by hiding irrelevant rows.
- Frequent filter review ensures accuracy as data changes.
- Troubleshooting requires checking data ranges, refreshes, and merged cells.
Table of Contents
Mastering Excel Pivot Table Filtering
Understanding Text Labels
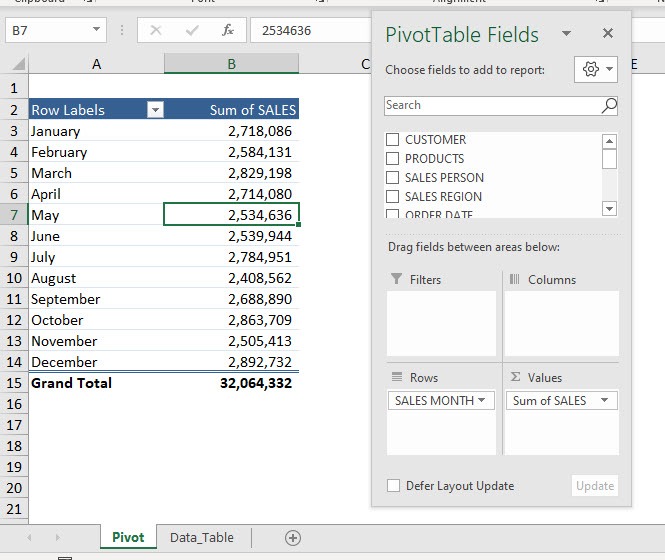
Text labels in Excel are essentially the names or descriptions given to data categories, and they serve as identifiers within your pivot table. They help you distinguish between different groups of data, such as “Products,” “Regions,” or “Departments.” By filtering these labels, we can quickly access specific segments of data, making it easier to track trends or patterns. For example, if you’re analyzing sales data, filtering by text labels allows us to isolate sales for a particular product, enabling a focused analysis without sifting through unrelated information. Understanding how these labels function is the first step toward leveraging pivot table filtering effectively.
Benefits of Using Filter by Labels
Using the filter by labels in Excel pivot tables offers several advantages that can significantly enhance our data analysis capabilities. Firstly, it allows us to focus on relevant data by narrowing down vast datasets to specific categories or text labels, improving clarity and efficiency. This focused approach facilitates quicker decision-making and targeted data assessments. Secondly, label filters streamline data presentations, making reports more concise and easier to interpret. When we need to compare specific data sets, these filters enable us to eliminate unnecessary information, thus maintaining our audience’s attention on the key insights. Additionally, this functionality supports dynamic data analysis, allowing easy adjustments and exploration of different data perspectives with just a few clicks.
Practical Examples of How to Filter by Labels – Text
Example 1: Ends with
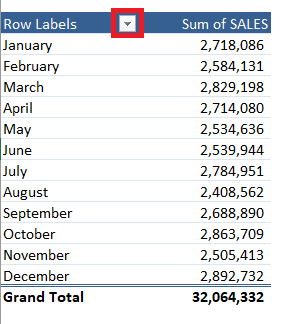
STEP 1: Click on the Row Label filter button in the Pivot Table.
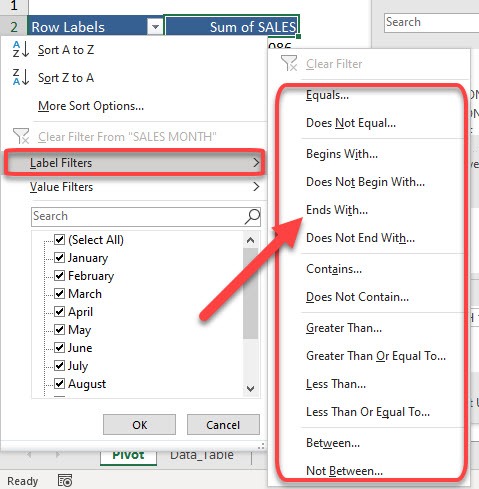
STEP 2: Select Label Filters.
You will see that we have a lot of filtering options. Let us try out – Ends With
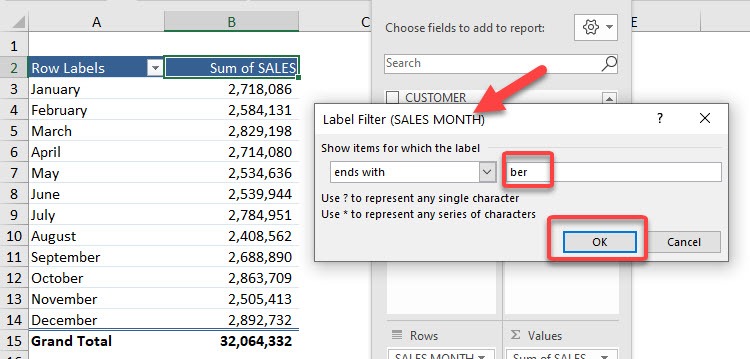
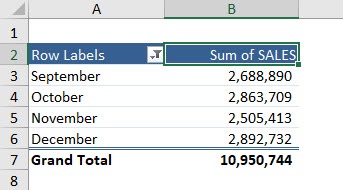
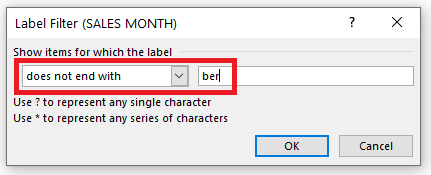
STEP 3: Type in ber to get the months ending in ber. You can see that the Label Filter will be applied to the SALES MONTH.
Click OK
Now we have the filtering applied in a flash!
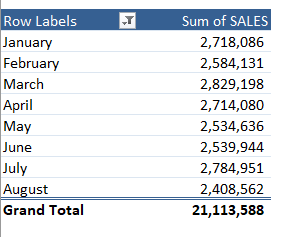
Similarly, we can use the “Does not End with” option to filter all months that do not end with ber.
The filtered data will look like this:
Example 2: Begins with
STEP 1: Click on the Row Label filter button in the Pivot Table.
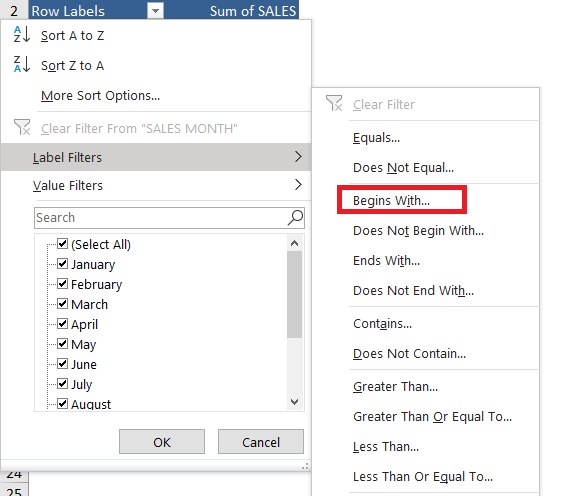
STEP 2: Select Label Filters.
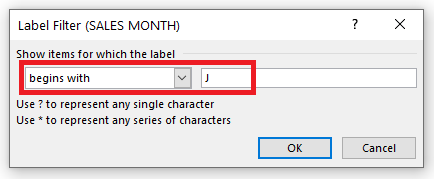
You will see that we have a lot of filtering options. Let us try out – Begins With
STEP 3: Type in J to get the months starting with J. You can see that the Label Filter will be applied to the SALES MONTH.
Click OK
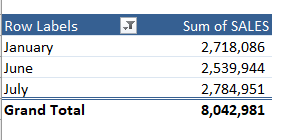
This is what the filtered Pivot Table will look like:
Example 3: Does not Begins with
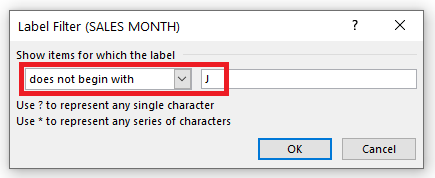
Similarly, we can use the “Does not Begin with” option to filter all months that do not begin with J.
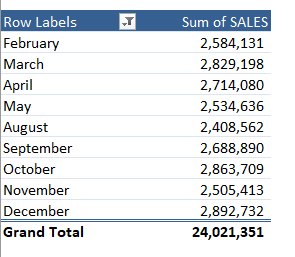
The filtered data will look like this:
Tips for Effective Filtering
To ensure our filtering is as effective as possible, consider these tips.
- First, always define clear objectives for what you want to achieve with your filtering. Having a specific goal in mind, whether it’s focusing on a particular product or region, aids in selecting the correct filter criteria.
- Second, familiarize yourself with the different filter options available in Excel to maximize their utility. This includes using both “Label Filters” and other types like value or date filters, which can be combined for more nuanced data analysis.
- Third, regularly review and adjust filters to ensure they continue to meet your changing data needs or objectives.
- Lastly, always double-check the filtered data for accuracy, confirming that it aligns with your expectations and hasn’t unintentionally omitted crucial information.
Keeping these strategies in mind facilitates precise and efficient data analysis.
Troubleshooting Common Issues
If a filter doesn’t seem to apply to your pivot table, there could be several reasons. First, check that the data source range is correctly set and includes all the necessary data. A common issue is that our pivot table isn’t refreshed, meaning it doesn’t recognize recent changes to the dataset. Refresh the pivot table to update it with the current data.
Another potential issue could be the presence of merged cells within the field you’re trying to filter, as these can disrupt filter application.
Finally, ensure no conflicting filters are already applied that might be blocking your new filter criteria.
Addressing these aspects usually resolves the issue, allowing the desired filter to apply correctly.
FAQs
What are label filters in Excel pivot tables?
Label filters allow you to filter pivot table data based on text values in row or column labels. These can include filters like “Begins With”, “Ends With”, “Contains”, and more. By using them, you can zero in on relevant categories quickly—say, only regions starting with “N” or months ending in “ber.” This is especially useful in large datasets where scrolling through rows isn’t practical.
How do I apply a label filter like “Begins With” or “Ends With”?
Click on the dropdown arrow of the Row or Column Label in your pivot table, then select Label Filters. Choose an option like “Begins With”, type your desired text (e.g., “J” for months starting with J), and click OK. The pivot table will immediately update to show only matching entries. You can also use “Does Not Begin With” or “Contains” for flexible filtering.
Why is my label filter not working in the pivot table?
If your filter isn’t working, first ensure your pivot table has been refreshed—otherwise, changes to the underlying data won’t be recognized. Next, confirm that your source range is correctly defined and doesn’t exclude data. Merged cells can also interfere with filtering, so it’s best to avoid them. Lastly, check for conflicting filters that may override or block new ones.
Can I combine label filters with other types like value or date filters?
Yes, Excel allows you to combine label filters with value or date filters for deeper analysis. For example, you can filter for products starting with “A” and having total sales above a certain amount. This lets you drill down into highly specific data subsets. However, keep in mind that overlapping filters might sometimes exclude more than you intended.
What are the best practices for filtering pivot tables by text?
Start by clearly defining what you’re trying to extract from the data—this helps pick the right filter. Know your available filter types and don’t just rely on labels; combine them with values or dates for more power. Always refresh the pivot after changing the source data. Lastly, periodically review filters to ensure they’re still relevant and not hiding critical information.
Bryan
Bryan Hong is an IT Software Developer for more than 10 years and has the following certifications: Microsoft Certified Professional Developer (MCPD): Web Developer, Microsoft Certified Technology Specialist (MCTS): Windows Applications, Microsoft Certified Systems Engineer (MCSE) and Microsoft Certified Systems Administrator (MCSA).
He is also an Amazon #1 bestselling author of 4 Microsoft Excel books and a teacher of Microsoft Excel & Office at the MyExecelOnline Academy Online Course.