Watch our free training video on How to Create Scatter Plot in Excel:


A scatter plot is a type of Excel Chart that displays individual data points on a two-dimensional graph. It is particularly useful for visualizing the relationship between two variables. In this article, we will cover the following topics in detail –
Download the Excel Workbook below to follow along and understand How to Create Scatter Plot in Excel – download excel workbookScatter-Plot-in-Excel.xlsx
Introduction to Scatter Plot
A Scatter Plot is an Excel Chart that helps in comparing variables or numerical values showing the relationship between the two. It helps to find out whether or not these variables are related. Each point on the graph corresponds to the values of two variables, and the position of the point is determined by its x and y coordinates.
Based on the pattern of the data points, you can determine the correlation between the two variables –
- Positive Correlation – In a positive correlation, as one variable increases, the other variable also tends to increase. Similarly, as one variable decreases, the other variable tends to decrease. In this scenario, the points form an upward-sloping line.
- Negative Correlation – In a negative correlation, as one variable increases, the other variable also tends to decrease. Similarly, as one variable decreases, the other variable tends to increase. In this scenario, the points form a downward-sloping line.
- No Correlation – In the case of no correlation, there is no apparent relationship between the two variables. Changes in one variable do not predict changes in the other variable. The data points on the plot are scattered without forming a clear pattern or trend.
How to Create Scatter Plot in Excel
In a local ice cream shop, the manager is interested in understanding how outdoor temperature influences the sales of ice cream. Data is collected over several weeks, recording the daily maximum temperature (in degrees Celsius) and the corresponding daily ice cream sales (in units).
You can use a scatter chart to understand how outdoor temperature influences the sales of ice cream cones.
- If the data points form an upward-sloping graph, it has a positive correlation.
- If the data points form a downward-sloping graph, it has a negative correlation.
- If there is no clear pattern, there is no correlation between the two.
Follow the steps below to create a scatter plot in Excel –
STEP 1: Select the table with both sets of numerical values.
STEP 2: Go to Insert > Scatter Charts > Scatter.
A scatter chart will be inserted into the worksheet!
STEP 3: Go to Chart Design > Chart Style. Here, you can select the preferred design to make the chart more presentable!
The new chart design will look like this –
STEP 4: You can label the x-axis and y-axis to make your chart more informative. Click on the chart, go to the Chart Elements button, and check the Axis Titles option.
STEP 5: Type Temperature in the X-axis and Ice Cream Sales in the Y-axis.
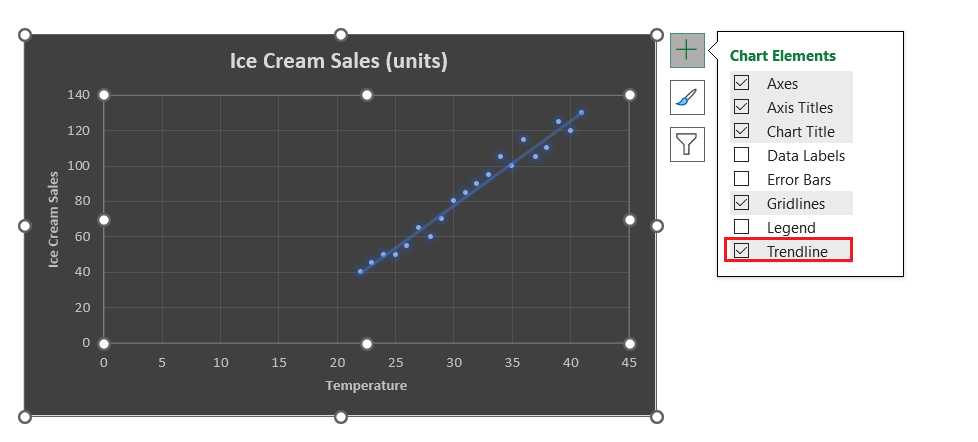
STEP 6: Click on the chart, go to the Chart Elements button, and check the Trendline option to add a trendline.
Looking at the scatter plot, we can observe a positive correlation. As the outdoor temperature increases, there is a general trend of higher ice cream sales. This suggests that there is a positive relationship between temperature and ice cream sales.
Application of Scatter Plot
The real-world applications of scatter plots in Excel are vast and diverse. Some of them are mentioned below –
- Finance – Analyze the relationship between interest rates and stock prices to make informed investment decisions.
- Marketing – Determine how marketing expenses impact product sales and identify the optimal advertising budget.
- Environmental Science – Explore the connection between pollution levels and public health outcomes in different regions.
- Manufacturing – Monitor the correlation between manufacturing process variables and product quality.
- Sports Analytics – Investigate the relationship between player statistics and team performance in sports like basketball or soccer.
- HR Analytics – Audit the relationship between high attrition rate and employee well-being in an organization.
Conclusion
A Scatter plot in Excel is a powerful tool for visually representing the relationship between two variables. The relationship can be positive, negative, or no correlation at all. This article covers the introduction to scatter plots, step-by-step guidance on creating them in Excel, and their practical applications across various fields.
After going through this article, you will surely be able to interpret the scatter chart and draw meaningful insights from the presented data.
Click here to learn more about Scatter Plot in Excel!


John Michaloudis is a former accountant and finance analyst at General Electric, a Microsoft MVP since 2020, an Amazon #1 bestselling author of 4 Microsoft Excel books and teacher of Microsoft Excel & Office over at his flagship MyExcelOnline Academy Online Course.


