Delve into Excel charts and you’ll encounter the term “slope,” crucial for understanding data relationships. Slope measures the tilt or inclination of a line, revealing trends over time. Excel’s ability to find slope of tangent line offers insights into how variables interact, empowering data-driven decisions.
Key Takeaways:
- Quantifying Trends: The slope determines the direction and velocity of trends, aiding predictions based on past performance.
- Directional Insight: A positive slope signifies upward trends, while a negative slope indicates downward trends, crucial for various analyses.
- Tangent Line Basics: Tangent lines touch curves at specific points, reflecting the curve’s steepness, pivotal in understanding derivatives and rates of change.
- Data Visualization: Tangent lines unveil dynamic dataset trajectories, facilitating insights into changes over time or conditions.
- Practical Implementation: Excel simplifies finding slopes with built-in formulas like SLOPE, enabling accurate trend analysis and forecasting.
Table of Contents
Introduction to Slope and Its Significance in Excel Charts
Unraveling the Mystery of Slope in Graphs
Dive into the world of Excel charts and you’ll quickly encounter the term “slope”—a concept fundamental to understanding the relationship between data points. Think of slope as a way of measuring the tilt or inclination of a line: it can reveal whether your data trends upward or downward over time. The power of Excel lies in its ability to compute the slope for you, offering valuable insights into how your variables interact.
Imagine having a set of data that shows the rise and fall of stock prices over a month. The slope helps to summarize that trend numerically, enabling you to grasp the rate of change at a glance.
The Role of Slope in Analyzing Trends
When analyzing trends in Excel, slopes are your best friends. They quantify the direction and velocity of a trend, allowing you to predict future behavior based on past performance. A positive slope points to an upward trend, indicating an increase in your Y values as your X values grow – think rising sales with increased advertising. On the flip side, a negative slope signals a downward trend, possibly hinting at declining customer interest over time.
Beyond mere prediction, slopes can serve as diagnostic tools. They can reveal subtle shifts in your data that might go unnoticed with a casual glance. Whether you’re a financial analyst scrutinizing market trends or a biologist tracking changes in growth rates, understanding slope can empower you to make informed decisions based on empirical data trends.
The Basics of Tangent Lines
What Is a Tangent Line?
Picture a curvy road winding up a hill. The tangent line is like a straight path that just grazes the curve of the road at one particular point without cutting across it. In the world of graphs and functions, a tangent line does something similar; it touches a curve on a graph precisely at one point, highlighting the direction of the curve at that instant. This special line has the same slope as the curve at the point of contact, which means it offers you a snapshot of how steep the curve is at that very point.

Understanding tangent lines is essential, particularly when delving into the territory of calculus; they’re the foundational concept behind derivatives and rates of change. But even without diving deep into math, you can visualize them in Excel to better understand the immediate rate of change in your dataset.
Importance of Tangent Lines in Data Visualization
Tangent lines in data visualization are like secret paths that reveal the trajectory of your data at any given point. They are particularly crucial when you’re dealing with dynamic datasets that change over time or with certain conditions. By drawing a tangent line on a graph, you gain immediate insight into the nature of the change at a specific point. Suppose you’re examining the population growth of a species; a tangent line can show the exact growth rate at a particular year.
In business or finance, tangent lines can be used to illustrate the rate of profit growth or loss at any quarter, helping project future possibilities. In economics, they can help to visualize concepts like marginal cost or marginal revenue at a precise production point. Essentially, tangent lines convert a complex story told by a curvy line into an understandable chapter, one point at a time.
Step-by-Step Guide to Find Slope of Tangent Line
Plotting the Data Points on an Excel Chart
Plotting data points on an Excel chart is your first step towards visualizing and analyzing the dataset. Start by selecting the range of data you want to illustrate, then look for the ‘Insert’ ribbon at the top of Excel’s interface.

Here, you’ll find several options to create different types of charts. Select a scatter plot from the list.

Once the scatter chart appears, you can right-click and select trendlines, which will pave the way for exploring slopes.

Within the “Trendline Options” in the Format Trendline pane, check the box labeled “Display Equation on the chart.

Remember, the initial graph is a draft; it’s the fine-tuning with trendlines and formatting options that lets you explore the nuances of your data.
Utilizing Formulas to Calculate Slope
Calculating the slope of a tangent line in your Excel chart can be done with surprising ease, thanks to the tool’s built-in functions. You won’t have to go back to your math class days and do manual calculations; Excel will do the heavy lifting for you. Simply use the SLOPE function, where you input the range of your dependent Y values and your independent X values as two separate arrays.
Here’s how you’d type it: =SLOPE(known_ys, known_xs). Once you hit Enter.

Excel calculates the slope using the formula (rise over run) for the line that best fits your data points. This function can be a game-changer when it comes to analyzing large datasets or when high accuracy is imperative.
Quick and calculating, the SLOPE function has got your back when you need to quantify the rate of change in your data.
Practical Examples of Slope Calculations
Case Study: Sales Trend Analysis
Imagine you’re the head of sales trying to decipher monthly sales trends to forecast the next quarter. By plotting a chart in Excel and finding the slope of its trendline, you can discern whether sales are growing, stagnating, or declining. Let’s say after adding a trendline to your sales chart, you find that the slope is positive. This indicates that for every period of time that passes, sales are increasing—a sign that current strategies might be effective or that market demand is rising.
But there’s more to it. The steeper the slope, the faster the sales are growing. If the slope is exceptionally steep, this could either be a sign of a significant market opportunity or a warning that the pace may not be sustainable in the long term. By deploying slope analysis in a sales context, you can not only track past performance but also predict future trends, giving your team crucial insights for strategic planning.
Applying Slope Insight for Financial Forecasting
When it comes to financial forecasting, slope insights are a crystal ball into your fiscal future. They can tell you at a glance whether revenues are heading north or if expenses are getting out of hand. In Excel, plotting your financial data and determining the slope of a trendline can help anticipate how a company’s earnings might grow or shrink over time. A positive, steady slope could mean your revenue forecasts will be looking up, prompting strategic investments or expansion. Conversely, a negative slope might serve as an early warning to tighten the purse strings and re-evaluate spending.
The slope found from past financial data sets a precedent for future expectations, but it’s important to remember that it’s not infallible. External factors, market changes, and unforeseen events can alter the trend. Nonetheless, a good handle on the slope can empower you with a starting point for more nuanced models and give you the foresight to pivot when necessary.
Tips and Tricks for Accurate Slope Determination
Ensuring Data Accuracy Before Calculation
Before diving into calculations, ensuring the accuracy of your data is critical. Garbage in, garbage out, as they say. Begin by meticulously checking your data for any inconsistencies or errors. This includes validating that numerical values are entered correctly, dates are uniformly formatted, and any outliers are investigated and accounted for. Consider employing Excel’s Data Validation feature to set rules for what data can be entered into certain cells, minimizing the risk of error.
Remember, the slope calculations will only be as accurate as the data you provide. It’s a good idea to clean and organize your datasets, making sure there are no missing values or incorrect entries. A little time spent on data cleaning can save a lot of headaches later on when interpreting your results.
Common Pitfalls to Avoid When Finding Slopes
The road to accurate slope calculations in Excel can be fraught with potential pitfalls, but being aware of them can save you from falling into error traps. One common mistake is mismatched range sizes. If you provide unequal numbers of X and Y values when calculating the slope, you’ll be greeted with a #N/A error that brings your analysis to a screeching halt.

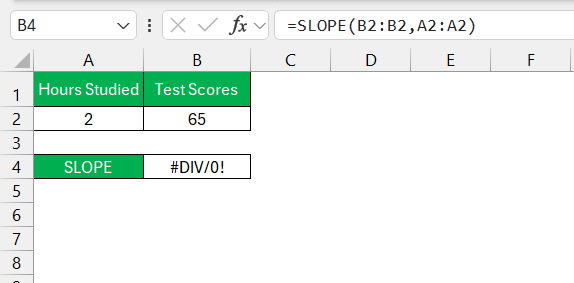
Also, look out for the dreaded #DIV! error, which means you’ve given the SLOPE function too few data points – insufficient for any meaningful calculation.
Another potential slip-up is not accounting for zero values, which Excel includes in calculations, possibly skewing results. Lastly, remember that blank cells or text strings within your data range will be ignored, potentially leading to an incorrect slope value if those cells contain valid data.
Keep your datasets tidy, your ranges matched, and your eyes peeled for Excel’s error codes to navigate the path of slope calculation smoothly.
FAQ Section
How do you find the tangent line in Excel?
To find the tangent line in Excel, you need to plot your main function, determine the point of tangency, and then use the SLOPE function to calculate the slope of the tangent. With these values, you can plot the tangent using the equation of a straight line, y=mx+b, where ‘m’ is the slope and ‘b’ is the y-intercept. Excel doesn’t have a direct function to insert tangent lines, but you can create one using a combination of plotting and the SLOPE function for precise analysis.
How to calculate the slope of a line in Excel?
To calculate the slope of a line in Excel, utilize the SLOPE function. Enter =SLOPE(known_ys, known_xs) into a cell, where known_ys and known_xs are the ranges of your data points for Y and X, respectively. This simple function performs the regression calculation, effectively giving you the slope of the line that best fits your data. Just ensure your selected ranges are of equal size and contain only numbers for an accurate result.
How do I differentiate between positive and negative slope?
Differentiating between a positive and negative slope in Excel is straightforward. A positive slope means that as your X values increase, so do your Y values, indicating an upward trend on the chart. Visually, the line slants upwards from left to right. A negative slope, on the other hand, implies that as X values increase, Y values decrease, showing a downward trend with the line slanting downwards from left to right. The SLOPE function will provide a positive or negative numerical value, clearly stating the slope’s direction.
Can I find the slope of a nonlinear curve in Excel?
Yes, you can find the slope of a nonlinear curve in Excel at a specific point using the SLOPE function together with additional calculations. Since the slope of a nonlinear curve changes at every point, you need to define the exact spot where you want to calculate the tangent’s slope. You’ll have to employ more advanced techniques, possibly involving calculus concepts such as derivatives, if you’re analyzing a curve based on an equation. For an empirical dataset, Excel can compute a linear approximation of the slope at discrete intervals within your dataset.
How do you find the equation of a line on excel if you only have the data points?
If you only have data points, you can still find the equation of a line in Excel by using scatterplot and trendline tools. Here’s how:
- Insert a scatter chart with your data points.
- Add a trendline by right-clicking a data point and selecting ‘Add Trendline.’
- In the ‘Format Trendline’ pane, check ‘Display Equation on chart.’
Excel will then calculate and show the equation of the line that best fits your data, in the form y = mx + b, where ‘m’ is the slope and ‘b’ is the y-intercept.

John Michaloudis is a former accountant and finance analyst at General Electric, a Microsoft MVP since 2020, an Amazon #1 bestselling author of 4 Microsoft Excel books and teacher of Microsoft Excel & Office over at his flagship MyExcelOnline Academy Online Course.


