When working with large spreadsheets, it can be difficult to manage wide datasets with multiple related columns. Grouping columns in Excel helps you collapse and expand sections, making your data easier to read and navigate. This feature is especially useful for financial reports, sales data, and project tracking where certain details can be hidden until needed.
Key Takeaways
- Grouping columns allows you to collapse or expand sections of data without deleting them.
- You can group multiple levels for more complex datasets.
- Excel provides both Ribbon and right-click options to group or ungroup columns.
- Keyboard shortcuts like
Alt + Shift + →can speed up grouping. - VBA can automate grouping for repetitive tasks.
Table of Contents
What is column grouping in Excel
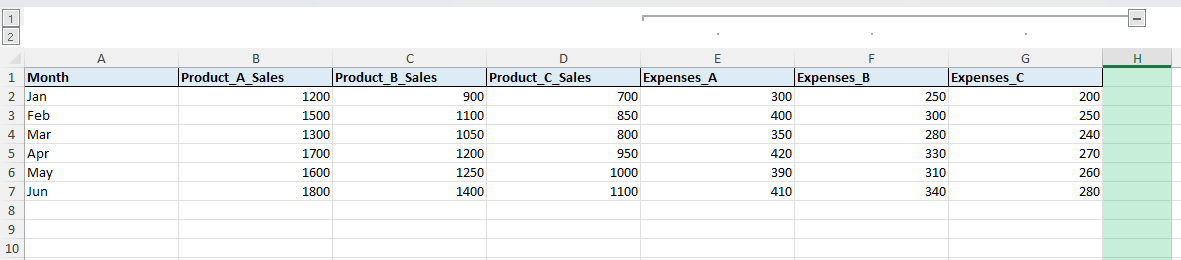
Column grouping in Excel is part of the Outline feature. It lets you collapse a set of columns into a single expandable section. For example, if you have monthly sales by product, you can group all product-related columns together. This reduces clutter and allows you to focus only on the columns you need at the moment.
How to group columns in Excel
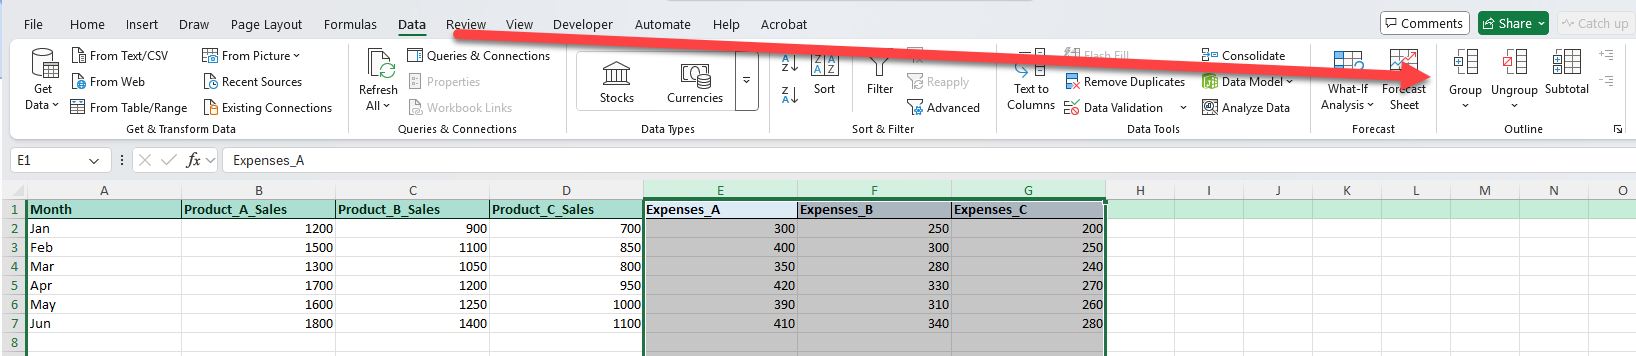
1. Using the Ribbon:
Select the columns you want to group.
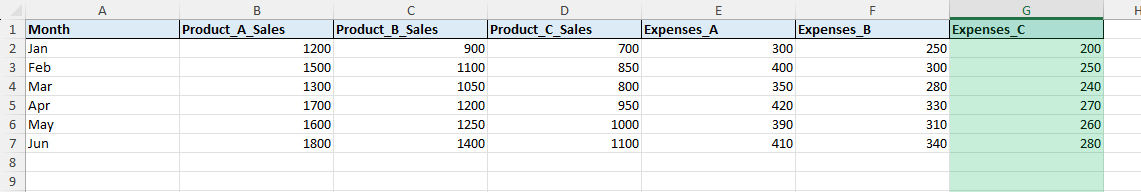
Go to Data > Outline > Group.
2. Using a keyboard shortcut:
Alt + Shift + →
This groups the selected columns.
Common mistakes and tips
Incorrect selection: Make sure you highlight the full columns, not just cells, before grouping.
Confusion with merged cells: Grouping works independently of merged cells. Avoid merging inside grouped areas to prevent alignment issues.
Multiple levels not managed: If you create multiple groups, remember you can collapse or expand them individually or all at once.
Accidental deletion: Collapsed columns are hidden, not deleted. Do not assume the data is lost.
Bonus tips and advanced scenarios
Create multiple outline levels: Group monthly data inside quarterly groups for hierarchical organization.
Automate grouping with VBA: Use macros to apply grouping across multiple sheets at once.
Use Power Query: Instead of grouping manually, use Power Query to restructure and summarize data before loading it into Excel.
Hide subtotals when grouping: If you use Subtotal with grouping, configure the settings to show only summary rows when collapsing columns.
Use cases
Financial statements. Group revenue, expenses, and profit columns so managers can view details only when required.
Why it matters: Financial reports often include a lot of line items such as operating expenses, cost of sales, and net income. Displaying everything at once can overwhelm decision-makers.
How to do it: Select the revenue and expense columns, then use Data > Group to collapse them under one section. Managers can expand when they want a deeper look.
Practical add-on: Add a summary column for net profit that remains visible even when revenue and expense details are collapsed.
Benefit: Enables executives to quickly focus on key performance indicators, while still allowing access to underlying details when needed.
Sales tracking. Group product-level sales data under a broader sales category to simplify reporting.
Why it matters: Sales teams often track multiple products across months. Grouping columns avoids scrolling across dozens of columns and helps compare categories more easily.
How to do it: Highlight the sales columns for related products, such as Product A, Product B, and Product C, then group them. Keep a total sales column outside the group.
Practical add-on: Use =SUM() across grouped columns to calculate category totals that remain visible even when details are collapsed.
Benefit: Provides both a high-level overview and the flexibility to drill into product details when required.
Project management. Collapse detailed task columns under a project summary for cleaner dashboards.
Why it matters: Projects often include multiple milestones, subtasks, and deadlines. Presenting every column can clutter a dashboard.
How to do it: Place columns like Task Start Date, End Date, Owner, and Status into a grouped section, leaving only the overall project summary visible by default.
Practical add-on: Apply conditional formatting to the summary column so overdue or completed projects are highlighted without needing to expand details.
Benefit: Project managers can quickly scan high-level progress, while still being able to expand groups to check detailed timelines or responsibility assignments.
Educational records. Group columns for different exam scores into a single expandable section per subject.
Why it matters: Student performance data often includes multiple assessments per subject, such as midterms, finals, and projects. Grouping makes gradebooks more compact and manageable.
How to do it: Select all assessment columns for one subject (e.g., Math Test 1, Math Test 2, Math Final) and group them. Keep an average or weighted grade column outside the group.
Practical add-on: Use formulas like =AVERAGE() or weighted averages to calculate subject-level scores that remain visible when the details are collapsed.
Benefit: Teachers and administrators can view subject-level performance at a glance without losing access to detailed scores for deeper analysis.
Inventory reports. Group supplier cost and quantity details so only key totals are displayed by default.
Why it matters: Inventory systems often track multiple details like supplier prices, reorder quantities, and warehouse stock. Grouping reduces clutter in day-to-day reporting.
How to do it: Group supplier-specific columns (cost, quantity, and reorder point) while leaving only the item name and total value column outside.
Practical add-on: Create calculated fields such as =Quantity*UnitCost for total value that remains visible even when supplier-level details are hidden.
Benefit: Streamlines daily stock monitoring while retaining the ability to expand groups for procurement or supply chain reviews.
FAQ
1. What is the difference between grouping and hiding columns?
Hiding columns removes them from view with no indicator. Grouping shows an expand/collapse button, making it easier to toggle visibility.
2. Can I group non-adjacent columns?
No, grouping works only for adjacent columns. For non-adjacent columns, repeat the grouping separately.
3. How do I remove a group?
Select the grouped columns, go to Data > Ungroup, or use Alt + Shift + ←.
4. Can I group both rows and columns in the same sheet?
Yes, Excel allows grouping rows and columns independently in the same worksheet.
5. Does grouping affect formulas?
No, formulas continue to work normally whether columns are collapsed or expanded.

John Michaloudis is a former accountant and finance analyst at General Electric, a Microsoft MVP since 2020, an Amazon #1 bestselling author of 4 Microsoft Excel books and teacher of Microsoft Excel & Office over at his flagship MyExcelOnline Academy Online Course.


