Microsoft Excel is a widely used tool for analyzing data, creating reports, and generating insights from raw datasets. Among its most versatile features is the Pivot Table, which allows users to summarize and organize large volumes of data efficiently. One of the most common tasks analysts perform is counting transactions—such as the number of sales, orders, or customer interactions—without manually reviewing each entry. Pivot Tables make this process simple, accurate, and highly dynamic.
In this article, we will explore how to count transactions in Excel using Pivot Tables.
Key Takeaways:
- Pivot Tables allow you to quickly summarize and count transactions in Excel without manual calculations.
- Transactions can be counted using the Values area by setting the field to Count or Distinct Count.
- Counting transactions helps track sales, monitor customer activity, and analyze operational metrics.
- Using unique identifiers and clean datasets ensures accurate transaction counts.
- Features like Slicers and the Data Model enhance interactivity and performance when counting transactions.
Table of Contents
Introduction to Pivot Tables and Counting Transactions
Understanding Pivot Tables
Before diving into counting transactions, it’s important to understand what Pivot Tables are and why they are so useful.
A Pivot Table is an Excel feature that allows you to summarize, analyze, explore, and present your data. It is called “pivot” because you can pivot, or rotate, the data to view it from different perspectives. For example, you can see the total sales by product, by region, by salesperson, or even by month—without changing the source dataset.
Pivot Tables work with fields, which correspond to column headers in your dataset. Fields can be placed in four main areas:
- Rows: These are used to group data into categories, such as Product, Region, or Customer.
- Columns: These display data across the top, such as Month, Year, or Product Type.
- Values: Numeric or transactional data that you want to summarize, such as Quantity, Amount, or Count.
- Filters: Fields that allow you to filter the data displayed in the Pivot Table, such as selecting only a specific region or timeframe.
Counting transactions typically involves using the Values area to calculate how many times a particular item or event occurs.
Why Counting Transactions is Important
Counting transactions is crucial for many business and analytical purposes:
- Sales Analysis: Track the number of sales per product, salesperson, or region to identify trends and top performers.
- Customer Insights: Count the number of purchases per customer to understand engagement and loyalty.
- Operational Metrics: Monitor the number of transactions processed daily, weekly, or monthly for performance analysis.
- Reporting: Summarize large datasets quickly and present actionable information to stakeholders.
Without Pivot Tables, counting transactions manually is tedious, error-prone, and time-consuming. Pivot Tables automate this process and make it easy to update as data changes.
Counting Transactions in a Pivot Table
Using Count in Values Area
Here is the current setup of our Pivot Table wherein we are getting the sum of sales:

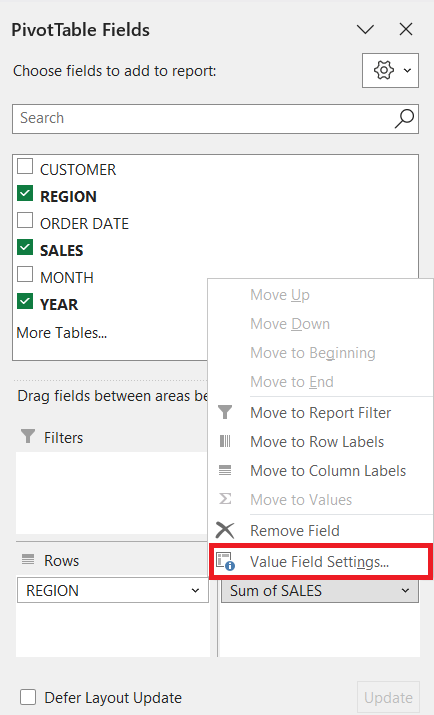
Right-click on your Pivot Table and select Summarize Values By > Count

With just that, the counts are now being shown!

Counting Unique Transactions
Sometimes, you may want to count unique transactions, such as counting distinct customers who made purchases rather than the total number of orders. In Excel 2013 and later, Pivot Tables support a Distinct Count option:
Drag the relevant field into the Values area. Click the drop-down arrow and select Value Field Settings.
Choose Count.
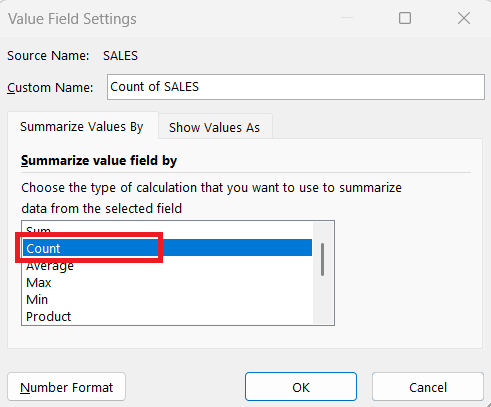
This counts each unique entry once, even if it appears multiple times in your dataset.
Best Practices for Counting Transactions
- Use Unique Identifiers: Always use a unique transaction ID or customer ID when counting to avoid errors.
- Avoid Blank Values: Pivot Tables may ignore blank rows; ensure data is clean.
- Enable Data Refresh: If your source data updates frequently, refresh the Pivot Table to maintain accuracy.
- Use Slicers for Interactive Counting: Slicers make it easy to filter and count transactions dynamically.
- Leverage Data Model for Large Datasets: The Data Model improves performance and supports advanced calculations like distinct counts.
FAQs
1. What is a Pivot Table in Excel?
A Pivot Table is a powerful Excel tool that allows you to summarize, analyze, and explore large datasets. It can pivot data to display it from different perspectives, such as by product, region, or month. Fields from your dataset can be placed in Rows, Columns, Values, or Filters areas. Pivot Tables automate calculations like sums, averages, and counts. This makes it easier to generate reports and insights without changing the source data.
2. How do I count transactions in a Pivot Table?
To count transactions, drag the relevant field (like Order ID) into the Values area of the Pivot Table. Right-click the field and select Summarize Values By > Count. Excel will then display the number of times each item occurs. For unique counts, use the Distinct Count option available in Excel 2013 and later. This provides an accurate tally of transactions or unique customers.
3. Why is counting transactions important?
Counting transactions helps track sales performance, monitor customer engagement, and measure operational efficiency. It provides insights into trends and patterns in your dataset. Analysts can identify top-performing products, regions, or salespeople. Accurate counts are also critical for reporting and decision-making. Pivot Tables make counting fast and dynamic, reducing manual errors.
4. How can I ensure accurate transaction counts?
Always use unique identifiers like Order ID or Customer ID to avoid duplicates. Clean your data to remove blanks or incorrect entries. Refresh your Pivot Table regularly to include updates from the source dataset. Using Distinct Count ensures unique items are counted correctly. Following these best practices minimizes errors and ensures reliable results.
5. Can I filter transactions dynamically in a Pivot Table?
Yes, you can use Filters or Slicers to dynamically view transaction counts. Filters allow you to display data for specific criteria, like a particular region or month. Slicers provide an interactive visual way to select categories and see counts update instantly. Combining filters with Count or Distinct Count provides flexible analysis. This makes Pivot Tables a highly interactive tool for monitoring transactions.

John Michaloudis is a former accountant and finance analyst at General Electric, a Microsoft MVP since 2020, an Amazon #1 bestselling author of 4 Microsoft Excel books and teacher of Microsoft Excel & Office over at his flagship MyExcelOnline Academy Online Course.


