Football fans and analysts often measure quarterback performance with the passer rating, also known as QBR. Instead of calculating it manually, you can build a QBR calculator in Excel to quickly analyze stats for multiple players and games. In this guide, we will explain the formula, walk through step-by-step instructions, and create a reusable calculator that you can customize.
Key Takeaways
- QBR (Passer Rating) is based on completions, attempts, yards, touchdowns, and interceptions.
- The formula produces a score between 0 and 158.3, where higher scores indicate better performance.
- Excel formulas can automate all the calculations for multiple players.
- Breaking down components into helper columns makes debugging and learning easier.
- VBA can be used to create a custom QBR function for convenience.
Table of Contents
Understanding the QBR Formula
The NFL passer rating formula is a weighted calculation using four components:
a = ((Comp/Att - 0.3) * 5)
b = ((Yards/Att - 3) * 0.25)
c = ((TD/Att) * 20)
d = (2.375 - (INT/Att * 25))
The final rating is:
= ((a + b + c + d) / 6) * 100
Each component is capped between 0 and 2.375 to prevent extreme values.
Setting Up Your Spreadsheet for Success
Mastering QBR (Quarterback Rating) calculations in Excel doesn’t have to be daunting. Start by organizing your spreadsheet effectively, and you’ll find that the process becomes quite manageable. First, choose a clean and intuitive layout. This will help in navigating and manipulating data with ease. Ensure each player has a row, and label column headings clearly for smooth reference.
Before entering any data, decide on the formulas and functions you’ll need – SUM, AVERAGE, and custom formulas should be on your checklist. It’s also essential to keep your data clean. Double-check for typos or inconsistencies, as these can affect your calculations. Excel tools such as ‘Data Validation’ can enforce data entry rules, minimizing errors.
Essential Data Columns You Need
To effectively calculate QBR in Excel, include the essential data columns, each capturing pivotal performance metrics. Start with “Player Name” for easy identification, followed by “Attempts” to record the total number of passes thrown. Next, include “Completions,” which helps in calculating completion percentage—a critical component of QBR.
Add “Yards” to register passing yards gained, and “Touchdowns” for the number of scoring throws, highlighting a player’s success in advancing the field. Don’t forget “Interceptions,” as these negatively impact QBR by reflecting the riskiness of plays.
Additionally, columns for “Sacks Taken” and “Rushing Yards” can enhance analysis, offering a well-rounded view of a quarterback’s efficiency and agility in avoiding defensive plays. With these columns set, you provide a detailed dataset ready for comprehensive QBR calculation.
How to Create a QBR Calculator
Entering Raw Data
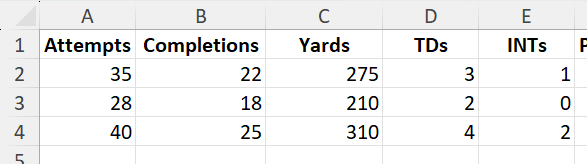
Start with a table of basic quarterback stats:
| Attempts | Completions | Yards | TDs | INTs |
|---|---|---|---|---|
| 35 | 22 | 275 | 3 | 1 |
| 28 | 18 | 210 | 2 | 0 |
| 40 | 25 | 310 | 4 | 2 |
Applying the QBR Formula in Excel
In the Passer Rating column, insert the formula:
=(((MAX(MIN(((B2/A2-0.3)*5),2.375),0) +
MAX(MIN(((C2/A2-3)*0.25),2.375),0) +
MAX(MIN(((D2/A2*20)),2.375),0) +
MAX(MIN((2.375-(E2/A2*25)),2.375),0))/6)*100)
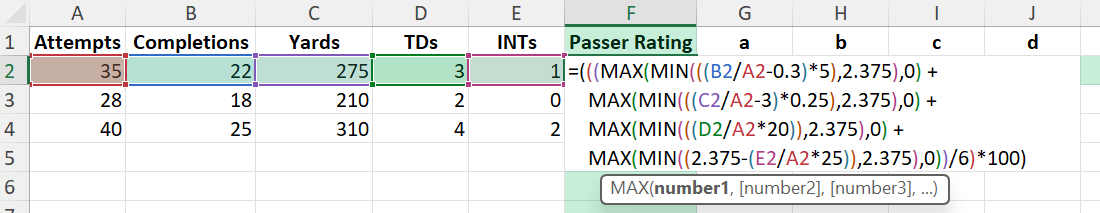
This automatically calculates the passer rating for each row of stats.
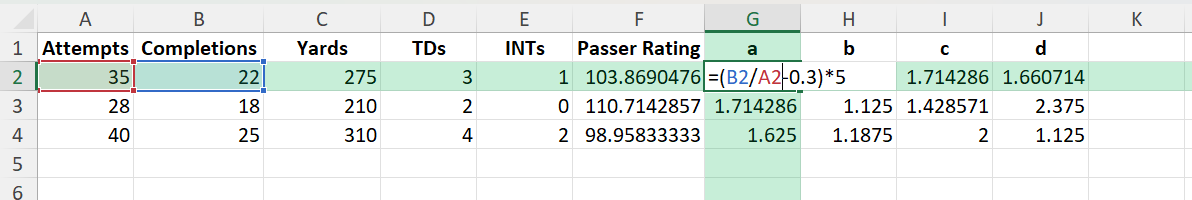
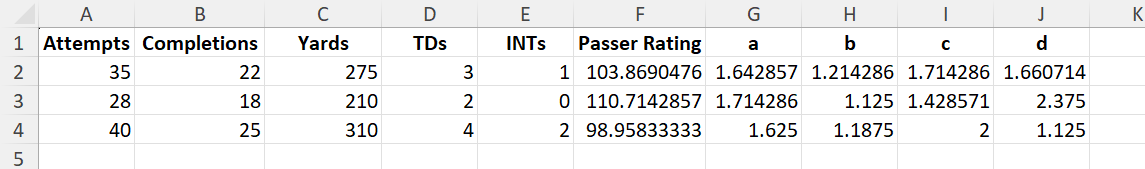
Using Helper Columns
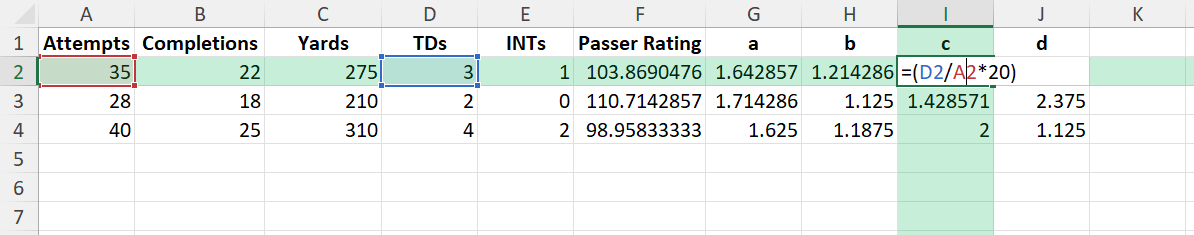
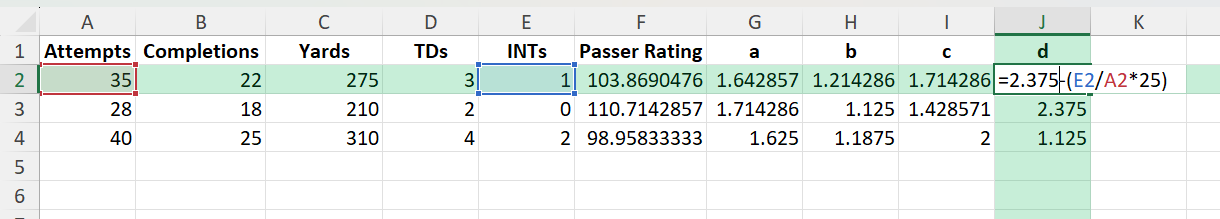
For better understanding, calculate each component (a, b, c, d) separately:
= (B2/A2 - 0.3) * 5
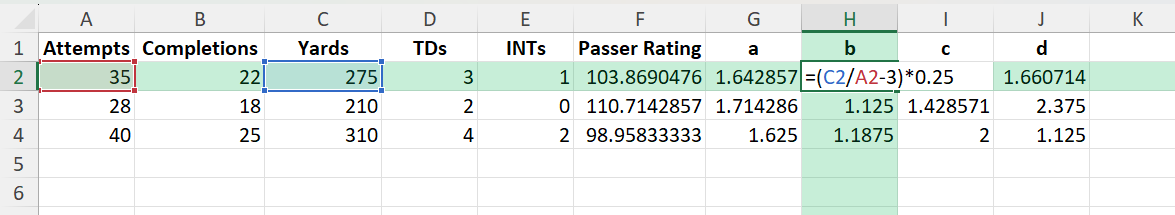
= (C2/A2 - 3) * 0.25
= (D2/A2 * 20)
= 2.375 - (E2/A2 * 25)
This breakdown helps verify the formula and troubleshoot errors.
Common Mistakes and Tips
Dividing by zero: Ensure attempts are never zero to avoid errors.
Missing caps: Always apply MIN and MAX to limit each component between 0 and 2.375.
Incorrect cell references: Double-check references when copying formulas across rows.
Data entry errors: Small mistakes in attempts or completions can distort ratings.
Bonus Tips and Advanced Scenarios
Comparison Charts: Create bar charts comparing passer ratings across multiple quarterbacks.
Power Query: Import NFL stat tables from the web and apply your QBR formulas automatically.
Conditional Formatting: Highlight ratings above 100 in green and below 70 in red for quick analysis.
Creating a VBA Function
You can add a custom function to make calculations easier:
Function QBRating(Att As Double, Comp As Double, Yds As Double, TD As Double, INT As Double) As Double
    Dim a As Double, b As Double, c As Double, d As Double
    a = ((Comp / Att) - 0.3) * 5
    b = ((Yds / Att) - 3) * 0.25
    c = (TD / Att) * 20
    d = 2.375 - ((INT / Att) * 25)

    If a < 0 Then a = 0 Else If a > 2.375 Then a = 2.375
    If b < 0 Then b = 0 Else If b > 2.375 Then b = 2.375
    If c < 0 Then c = 0 Else If c > 2.375 Then c = 2.375
    If d < 0 Then d = 0 Else If d > 2.375 Then d = 2.375

    QBRating = ((a + b + c + d) / 6) * 100
End Function
Now you can use =QBRating(A2,B2,C2,D2,E2) in a worksheet just like any built-in function.
Use Cases for a QBR Calculator
Sports Analysts: Quickly compare quarterback performances.
Fantasy Football: Evaluate which players deliver consistently strong results.
Coaches: Track performance across multiple games.
Fans: Run your own analysis of weekly games.
Data Projects: Build dashboards that include QBR as part of player statistics.
FAQ
What is the maximum QBR in the NFL system?
The highest possible rating is 158.3, often called a perfect passer rating.
How is QBR different from ESPN’s Total QBR?
The NFL passer rating only uses passing stats, while ESPN’s Total QBR includes rushing, sacks, and game context. The Excel calculator covers the NFL passer rating.
Can this be used for college football stats?
Yes, but some leagues may use variations of the formula. Always confirm before applying.
Do I need VBA to calculate QBR?
No, the formulas alone are enough. VBA is optional for convenience.
How do I make my QBR calculator dynamic?
Turn your data into an Excel Table so that formulas automatically extend to new rows when you add games.

John Michaloudis is a former accountant and finance analyst at General Electric, a Microsoft MVP since 2020, an Amazon #1 bestselling author of 4 Microsoft Excel books and teacher of Microsoft Excel & Office over at his flagship MyExcelOnline Academy Online Course.


