Regression analysis is one of the most powerful tools in Excel for understanding relationships between variables. Whether you are working on business forecasts, academic research, or financial modeling, regression helps you estimate how one variable influences another. With Excel’s built-in formulas and the Analysis ToolPak, you can run regression quickly and interpret results effectively.
Key Takeaways
- Regression helps quantify the relationship between independent (X) and dependent (Y) variables.
- Excel provides built-in formulas like
SLOPE,INTERCEPT, andRSQfor simple linear regression. - The Analysis ToolPak offers detailed regression output including coefficients, R², and ANOVA tables.
- You can automate regression calculations using VBA for repetitive tasks.
- Regression is widely used in forecasting, business analysis, and research applications.
Table of Contents
About Regression in Excel
Regression analysis estimates the relationship between a dependent variable (Y) and one or more independent variables (X). In simple linear regression, the relationship is expressed as:
Y = Intercept + Slope * X + ErrorThis allows you to predict Y values based on X inputs and understand how strongly they are related. Excel provides both formula-based and tool-based approaches for regression analysis.
Step-by-Step: Running Regression in Excel
Step 1: Prepare Your Data
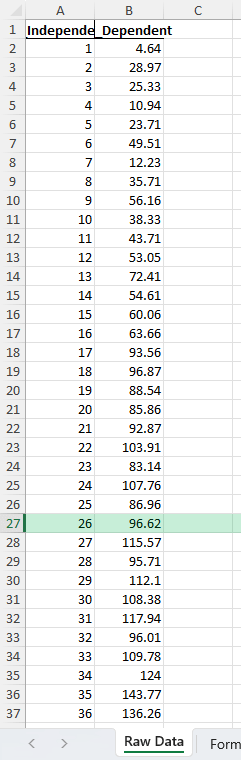
Enter independent variable values (X) in one column and dependent variable values (Y) in another. For example:
Step 2: Use Regression Formulas
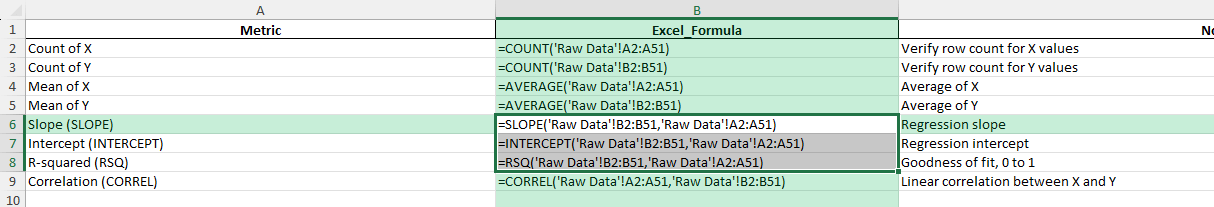
Slope: =SLOPE(Y_range, X_range)
Intercept: =INTERCEPT(Y_range, X_range)
R²: =RSQ(Y_range, X_range)
These formulas provide the equation of the regression line and its explanatory power.
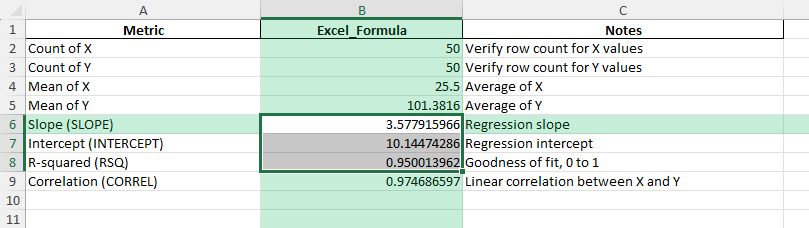
Step 3: Interpret Results
Slope: Shows the rate of change of Y with respect to X.
Intercept: The expected value of Y when X is 0.
R²: Explains how much variation in Y is explained by X.
Common Mistakes and How to Fix Them
Not enabling the Analysis ToolPak: Without this add-in, you cannot access full regression analysis.
Confusing X and Y ranges: Ensure dependent variable (Y) is selected correctly or results will be meaningless.
Using too few data points: Regression requires a sufficient sample size for reliable results.
Ignoring R² values: A low R² indicates the model does not explain much variance.
Bonus Tips and Advanced Scenarios
Multiple Regression: Use the ToolPak with multiple independent variables to build complex models.
Power Query Preprocessing: Clean and transform data before regression for more accurate results.
VBA Automation: Automate slope and intercept calculations with a macro for recurring datasets.
Scatter Plots with Trendlines: Visualize regression by adding a trendline and showing the equation on the chart.
Residual Analysis: Examine residuals to check if regression assumptions hold true.
Use Cases for Regression in Excel
1) Business Forecasting
Context: Businesses rely on forecasting to plan for inventory, staffing, and resource allocation. Historical sales data often provides patterns that can be extended into the future with regression models.
Application: By placing monthly or quarterly sales as the dependent variable (Y) and time periods or external drivers (such as marketing spend, seasonality indexes, or economic indicators) as independent variables (X), regression helps generate projections. Excel’s SLOPE and INTERCEPT functions can create a trend line that predicts sales for future months.
Value: This allows companies to estimate demand more accurately, adjust procurement schedules, and make better hiring and budgeting decisions.
2) Financial Modeling
Context: Finance professionals often study how securities behave compared to benchmarks. For example, stock returns might be analyzed against market index returns to evaluate performance.
Application: In Excel, you can set daily stock returns as Y and daily index returns as X. Using regression analysis, the slope (also known as beta) indicates how sensitive the stock is to the market. The intercept shows the stock’s performance independent of the market. R² explains how much of the stock’s movements can be attributed to market trends.
Value: Investors and analysts use this information to assess portfolio risk, diversify holdings, and evaluate fund managers’ performance relative to benchmarks.
3) Academic Research
Context: Regression is fundamental in many research studies where the goal is to understand relationships between variables. Whether in social sciences, medicine, or engineering, regression provides evidence for or against hypotheses.
Application: For example, a medical researcher might test whether dosage levels (X) affect patient recovery times (Y). In Excel, regression output can show whether there is a statistically significant relationship and how strong it is. Researchers can also include multiple variables, such as patient age or treatment type, for more robust models.
Value: This quantifies cause-and-effect relationships, supports academic publications, and guides practical recommendations in real-world settings.
4) Operations
Context: Manufacturing and operations teams aim to reduce costs while increasing efficiency. One key factor is understanding how production volume influences cost per unit.
Application: Historical data on production output (X) and total costs (Y) can be analyzed using regression in Excel. The slope represents variable cost per unit, while the intercept reflects fixed costs. By modeling these, operations managers can project costs at different production levels.
Value: Regression supports decision-making for pricing, resource planning, and scaling production up or down while maintaining profitability.
5) Marketing
Context: Marketing teams often need to justify ad spend by showing how it contributes to revenue growth. Regression provides an objective way to measure return on investment.
Application: Marketers can place advertising spend as X and revenue as Y in Excel. Running regression analysis shows how much of revenue growth is explained by marketing investments. By including multiple channels (social media, search ads, email), marketers can compare effectiveness across campaigns.
Value: This enables better budget allocation, helps avoid wasted spend, and provides quantifiable results to stakeholders who demand proof of ROI.
FAQ
What is regression in Excel?
Regression is a statistical method to study the relationship between dependent and independent variables.
How do I run regression using formulas?
Use =SLOPE(), =INTERCEPT(), and =RSQ() functions.
How do I access the Regression Tool?
Enable the Analysis ToolPak and select Regression from Data Analysis options.
Can I run multiple regression in Excel?
Yes, the Regression Tool supports multiple independent variables.
What does R² mean in regression?
It measures the proportion of variation in the dependent variable explained by the independent variable(s).

John Michaloudis is a former accountant and finance analyst at General Electric, a Microsoft MVP since 2020, an Amazon #1 bestselling author of 4 Microsoft Excel books and teacher of Microsoft Excel & Office over at his flagship MyExcelOnline Academy Online Course.


