Excel tables are a powerful tool for organizing and analyzing data efficiently. As someone who frequently uses Excel for various tasks, I’ve found that mastering the Total Row feature is indispensable for creating quick summaries and insights. This guide will walk you through the essential aspects of integrating and maximizing Total Row Calculations in Excel, providing you with the edge in data analysis.
Key Takeaways:
- Total Rows instantly summarizes your data with built-in functions like Sum, Average, and Count.
- They update automatically when you modify or add new entries—no manual recalculations needed.
- Adding a Total Row is quick via the Table Design tab—no formulas required.
- Total Rows improve visibility of key figures, aiding fast and accurate decision-making.
- Even beginners can use Total Rows, making them ideal for teams of all skill levels.
Table of Contents
Unleash the Power of Total Rows in Excel
Why Total Rows Matter
Total Rows are a crucial element in Excel tables, offering a convenient way to perform quick calculations without manual input. When I use Total Rows, I can instantly sum up, average, or count data in just one click. This saves time and reduces the risk of errors in manual calculations. It provides a clearer view of the overall data set, enabling me to make informed decisions rapidly. In essence, Total Rows enhance efficiency and accuracy in data analysis, making them an invaluable tool for any Excel user.
Key Benefits for Data Analysis
Incorporating Total Rows into Excel tables offers several key benefits for data analysis. First, it streamlines the calculation process, allowing me to quickly summarize large data sets with minimal effort. This efficiency significantly enhances productivity. Second, Total Rows provides instant insights by automatically updating calculations when data changes, ensuring accuracy without constant manual revisions. Third, the feature is user-friendly; even those with limited Excel experience can utilize it effectively, making data analysis accessible to all team members.
Total Rows also supports transparency, as it keeps calculations visible and understandable within the table. Finally, this tool fosters better decision-making by presenting summarized data clearly, allowing us to draw insights swiftly and with confidence.
Step-by-Step Guide for Total Row Calculations
Preparing Your Table
Before adding a Total Row, I ensure that my data is properly organized as a table in Excel. This preparation is crucial for effective data analysis and allows the Total Row features to work seamlessly.
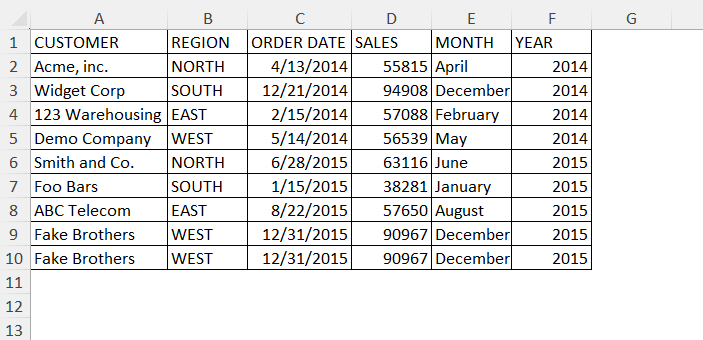
STEP 1: I arrange my data in a clean, structured manner with headers for each column. This setup is essential for clarity and ease of use.
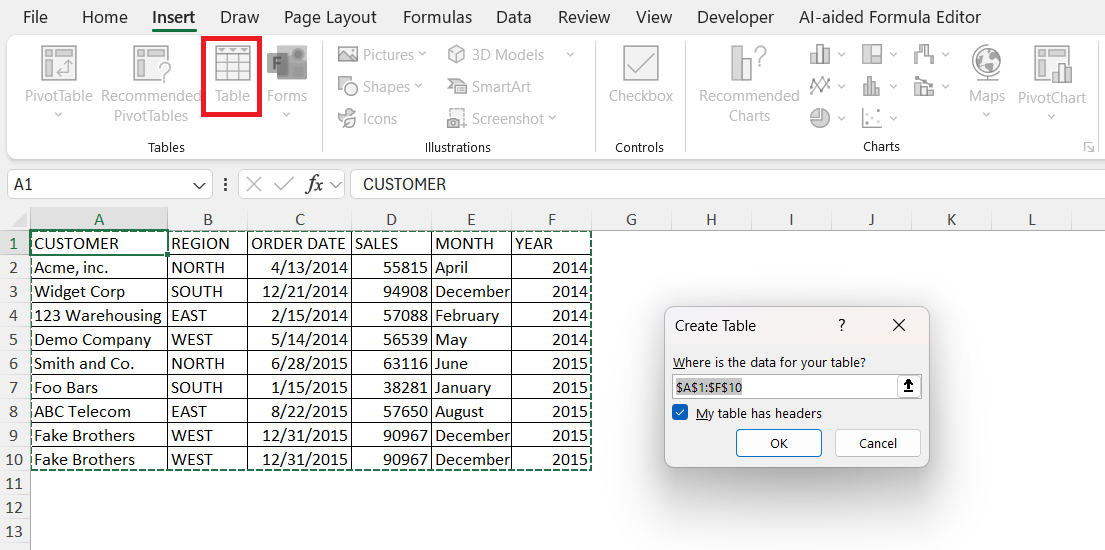
STEP 2: To convert my range of data into a table, I select the data range and click the “Insert” tab on the ribbon. From there, I choose “Table,” making sure the “My table has headers” option is checked if applicable.
Once my data is converted into a table, I review it to ensure the format aligns correctly with column headers and rows. This helps in effortless navigation and selection of data for further analysis.
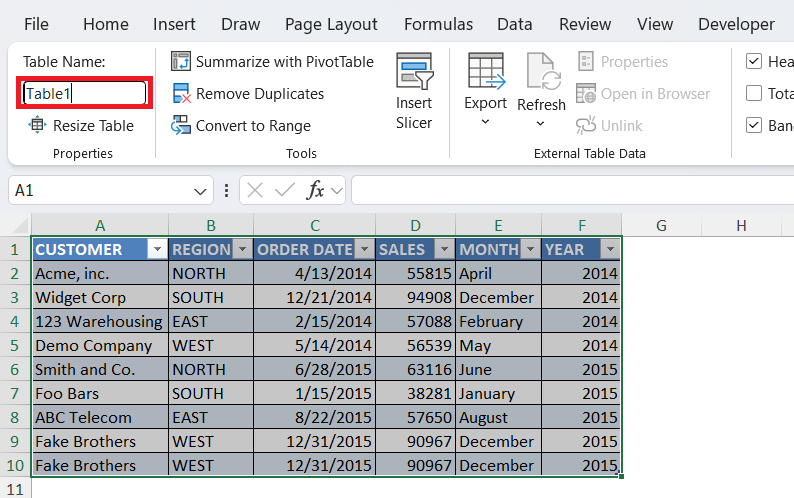
STEP 3: I assign a name to my table using the “Table Design” tab to easily reference it in formulas and in the Total Row settings.
With these steps, my data is ready, and I can efficiently apply Total Row calculations to gain insights quickly and accurately. Preparing the table properly not only enhances functionality but also makes data management more straightforward.
Inserting a Total Row
Inserting a Total Row in an Excel table is a straightforward process that provides instant insights into my data. Once my table is prepared, I follow these steps:
STEP 1: Select any cell in your table. Go to Table Tools > Design > Table Style Options > Total Row

STEP 2: A new row has been added. Select Count for the REGION column

STEP 3: Select Max for the ORDER DATE column
.

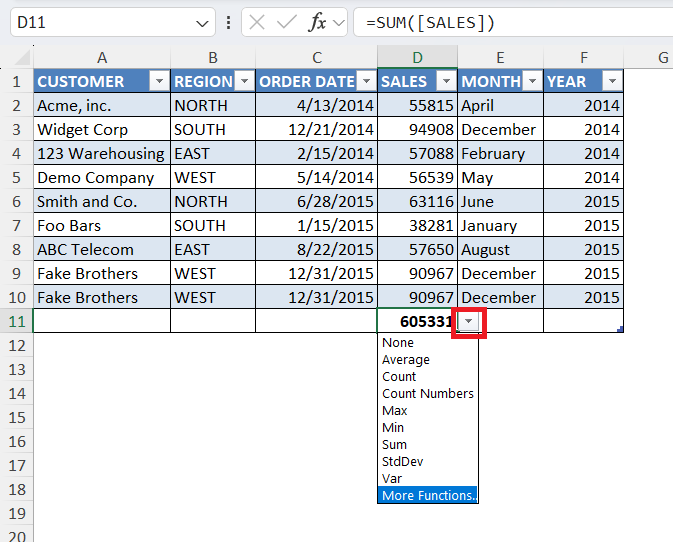
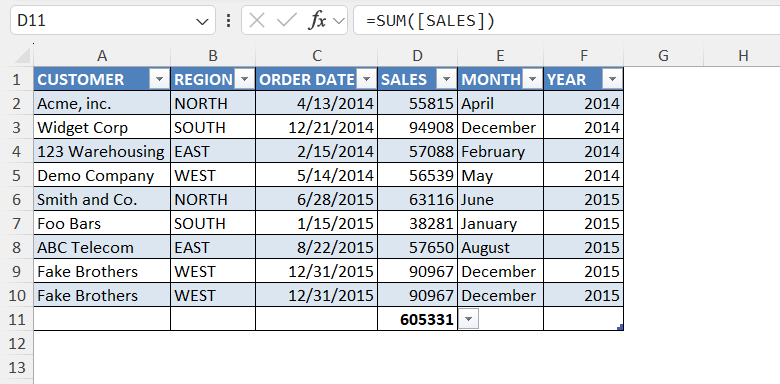
STEP 4: Select Sum for the SALES column

Now you have your updated values! They get updated automatically as you add new rows and change values!

Tips & Tricks for Total Rows
- Shortcut to Add Total Row: After converting your range to a table (
Ctrl + T), just pressAlt + J Tthen hitTagain to toggle the Total Row on or off. - Mix & Match Functions: You don’t have to use the same function for each column—mix
Count,Average, andSumto extract multiple insights.
- Rename Your Table: Give your table a name in the Table Design tab for easy reference in formulas (e.g.,
=SUM(SalesTable[Amount])).
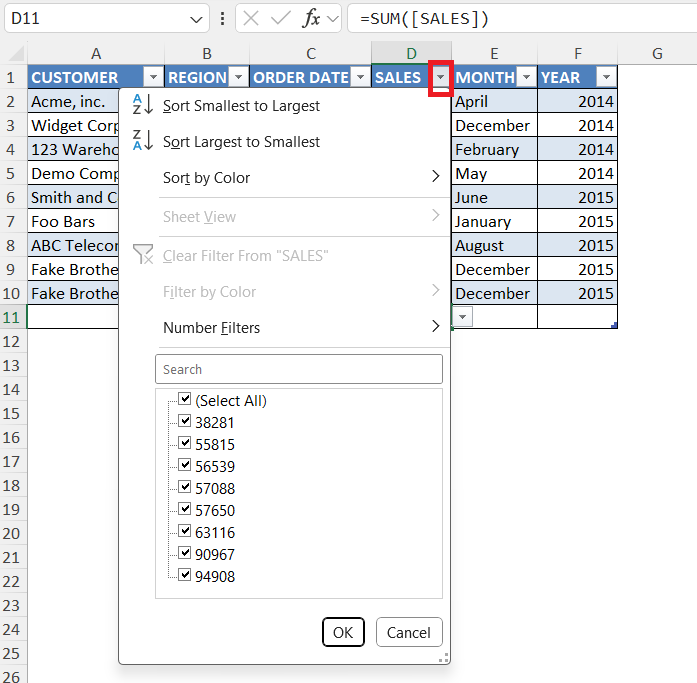
- Filter with Purpose: Use filters with the Total Row to get quick summaries for specific categories, like total sales for one region or timeframe.
- Use Structured References: In formulas, refer to table columns by name (e.g.,
[Sales]) to keep your formulas clean and readable.
FAQs
What is a Total Row in Excel, and how does it work?
A Total Row is a built-in feature in Excel tables that lets you perform quick calculations—like sum, average, and count—at the bottom of a table. It appears as a special row and is dynamic, meaning it updates automatically when the table’s data changes. You can choose different functions for each column directly from the dropdowns. This makes it ideal for instant analysis and reporting.
Do Total Rows update when I add or delete rows in my table?
Yes, that’s one of their biggest strengths. The Total Row automatically adjusts when you add or delete entries from the table. For example, if you add a new sales record, the “Sum” or “Average” in the Total Row reflects that change immediately. There’s no need to adjust formulas manually. It’s a major time-saver and reduces the risk of errors.
Can I customize the calculations in the Total Row?
Absolutely. You can select different functions per column using the dropdown in each cell of the Total Row. Common options include Sum, Average, Count, Min, Max, and more. Excel also allows you to write custom formulas in the Total Row if the default ones don’t meet your needs. This flexibility is great for tailoring your table to specific analysis goals.
Is the Total Row feature available in all versions of Excel?
The Total Row is available in Excel 2007 and later, including Microsoft 365. However, some styling and functionality might differ slightly across versions. If you’re using an older version, you may need to use manual formulas. For full functionality, it’s best to work with structured Excel Tables (created using the “Insert Table” option).
Will the Total Row affect my sorting or filtering?
No, the Total Row remains fixed at the bottom of the table even when you apply filters or sort your data. It’s designed to stay out of the way of your data operations but still reflect the latest filtered view. For example, if you filter by region, the Total Row will show totals only for the visible rows, making it incredibly useful for dynamic analysis.

John Michaloudis is a former accountant and finance analyst at General Electric, a Microsoft MVP since 2020, an Amazon #1 bestselling author of 4 Microsoft Excel books and teacher of Microsoft Excel & Office over at his flagship MyExcelOnline Academy Online Course.


