True Position is a common calculation in Geometric Dimensioning and Tolerancing (GD&T). It measures how far a feature such as a drilled hole is from its exact theoretical location. Manufacturers, engineers, and quality inspectors often use True Position to evaluate whether parts meet design tolerances. With Excel, you can create a simple and effective calculator to measure True Position quickly and consistently.
Key Takeaways
- True Position is used in GD&T to measure how far a feature deviates from its intended location.
- The formula is
True Position = 2 * SQRT((Xdeviation)^2 + (Ydeviation)^2). - Excel makes it easy to calculate True Position using built-in formulas.
- You can add helper columns and conditional formatting to flag values outside tolerance limits.
- A downloadable workbook is included with ready-to-use examples.
Table of Contents
What is True Position?
In GD&T, True Position defines the exact theoretical location of a feature. It is often applied to holes, pins, or slots that must align precisely in manufactured parts. The calculation considers deviations in both X and Y directions from the intended location. If the True Position is within specified tolerance limits, the part passes inspection.
Step-by-Step: Building a True Position Calculator in Excel
Step 1: Enter the Raw Data
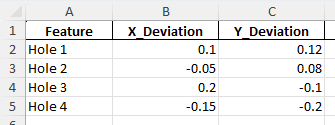
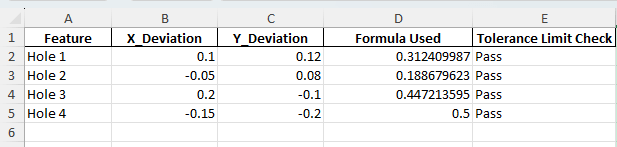
In Excel, create a table with the following columns: Feature, X Deviation, and Y Deviation. For example:
Step 2: Apply the True Position Formula
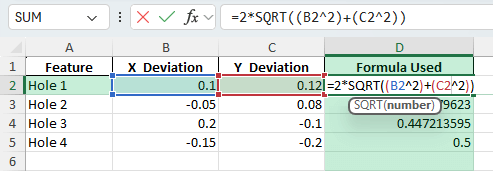
In a new column, enter the formula:
=2*SQRT((B2^2)+(C2^2))This calculates the True Position for the first feature using X and Y deviations.
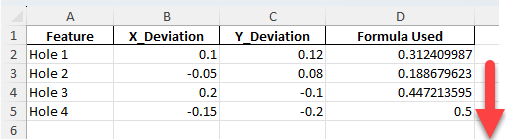
Step 3: Copy the Formula for All Rows
Drag the fill handle down to apply the formula to other rows. Excel will update the references automatically.
Step 4: Compare Against Tolerance Limits
Add another column for Pass/Fail checks. For example:
=IF(D2<=0.5,"Pass","Fail")

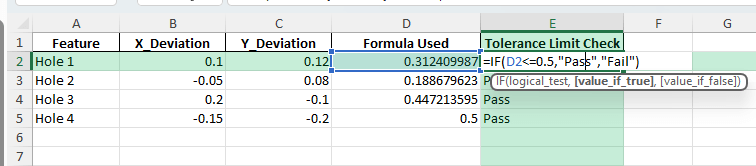
This flags whether the True Position value is within the allowable tolerance (0.5 in this example).
Common Mistakes and How to Fix Them
Wrong formula structure: Ensure both X and Y deviations are squared before adding.
Forgetting the factor of 2: The final True Position formula must multiply by 2.
Incorrect cell references: Always double-check that the formula references the correct X and Y cells.
Not formatting decimals: Engineering calculations require precision. Always adjust decimal formatting.
No tolerance check: Without a tolerance comparison, you cannot determine if a part passes inspection.
Bonus Tips and Advanced Scenarios
Conditional Formatting: Highlight cells where True Position exceeds tolerance values. This provides immediate visual feedback.
Automating with Power Query: Import inspection data directly from measurement systems and apply the True Position formula automatically.
VBA Automation: Use VBA macros to calculate True Position across multiple worksheets:
Sub CalculateTruePosition()
    Dim ws As Worksheet
    For Each ws In ThisWorkbook.Sheets
        If ws.Name <> "Summary" Then
            ws.Range("D2:D100").Formula = "=2*SQRT((B2^2)+(C2^2))"
        End If
    Next ws
End Sub
3D Calculations: Extend the formula for Z-axis deviations: =2*SQRT((X^2)+(Y^2)+(Z^2)).
Dashboards: Create a summary sheet showing pass rates, averages, and charts for quality control reporting.
Use Cases for True Position Calculations
True Position is not just a theoretical formula; it plays a vital role in manufacturing, design, and training. Below are detailed use cases showing how this calculation is applied in practice and how Excel can support each scenario.
1) Manufacturing Quality Control
Context: Factories and machine shops must confirm that drilled holes, pins, and cutouts are placed within design tolerances. Even small deviations can affect assembly, cause product defects, or increase scrap costs.
How to use in Excel:
Import measurement data from CMM (Coordinate Measuring Machine) reports into Excel.
Apply the True Position formula across large datasets using =2*SQRT((X^2)+(Y^2)).
Add a column for Pass/Fail checks against tolerance values with =IF(D2<=0.5,"Pass","Fail").
Use conditional formatting to color-code compliant and non-compliant parts.
Benefits:
Ensures parts meet GD&T standards before leaving the production floor.
Reduces rework and scrap by quickly identifying non-conforming features.
Improves customer satisfaction by delivering consistent, high-quality parts.
2) Engineering Design Verification
Context: During prototype development, engineers must confirm that parts align with the CAD model and function properly in assemblies. True Position is key to ensuring that holes and slots are precisely located for fit and function.
How to use in Excel:
Record X and Y deviations between prototype measurements and theoretical CAD positions.
Use Excel formulas to calculate True Position for each feature.
Summarize results in charts to compare prototype measurements against design tolerances.
Apply Excel dashboards to present results to design and engineering teams.
Benefits:
Provides clear data to confirm whether prototypes meet design specifications.
Supports iterative improvements before mass production begins.
Reduces the risk of costly changes after tooling is finalized.
3) Supplier Audits and Compliance Checks
Context: Companies often rely on external suppliers to produce parts. Supplier quality must be verified to ensure adherence to GD&T specifications. True Position checks are a standard part of supplier audits.
How to use in Excel:
Consolidate measurement reports from multiple suppliers into one Excel workbook.
Apply batch formulas to calculate True Position across dozens or hundreds of parts.
Use PivotTables to summarize compliance rates per supplier or production lot.
Highlight trends with charts showing recurring deviations by supplier.
Benefits:
Ensures suppliers deliver parts that meet contractual specifications.
Helps identify consistent quality issues across supplier lots.
Supports negotiations and corrective actions with objective data.
4) Production Monitoring and Process Control
Context: In high-volume manufacturing, monitoring trends over time is crucial. Even if a part passes tolerance today, a drifting process can lead to future failures. True Position calculations track whether processes stay within control limits.
How to use in Excel:
Set up time-series data showing feature deviations across production runs.
Use the True Position formula to calculate positional accuracy for each run.
Create charts showing trends, averages, and variation over time.
Add statistical process control (SPC) limits to monitor whether results stay within tolerance bands.
Benefits:
Detects early warning signs of tool wear or process drift.
Improves production consistency by providing real-time feedback.
Reduces downtime by addressing issues before they result in defects.
5) Training and Education
Context: True Position is a key concept in GD&T education for engineers, machinists, and quality inspectors. Training exercises often include calculating True Position manually and with software.
How to use in Excel:
Create practice datasets with X and Y deviations for students.
Ask students to apply the formula step by step using Excel functions.
Introduce 3D extensions by adding Z deviations to the formula =2*SQRT((X^2)+(Y^2)+(Z^2)).
Use charts and conditional formatting to visualize passing and failing cases.
Benefits:
Provides hands-on experience with GD&T calculations in a familiar tool.
Reinforces accuracy and precision in engineering training.
Bridges the gap between theoretical GD&T concepts and real-world application.
FAQ
What is the formula for True Position in 2D?
True Position = 2 * SQRT((Xdeviation)^2 + (Ydeviation)^2).
How do I handle 3D measurements?
Add the Z deviation squared into the formula: =2*SQRT((X^2)+(Y^2)+(Z^2)).
What units should I use?
Use consistent units (e.g., millimeters) for X, Y, and tolerance values.
Can Excel be used for batch calculations?
Yes, Excel handles large datasets with formulas or macros to process many parts at once.
What tolerance value should I set?
The tolerance depends on engineering drawings and industry standards. Always use specified limits.

John Michaloudis is a former accountant and finance analyst at General Electric, a Microsoft MVP since 2020, an Amazon #1 bestselling author of 4 Microsoft Excel books and teacher of Microsoft Excel & Office over at his flagship MyExcelOnline Academy Online Course.


