The Data Analysis Toolpak in Microsoft Excel is a powerful add-in designed to enhance your spreadsheet’s analytical capabilities. It provides a suite of tools for performing complex data analysis, including statistical tests, data visualization, and regression analysis, all within the familiar Excel environment. With Toolpak, users can streamline their data analysis workflow, making it an essential resource for students, professionals, and data enthusiasts alike. This article will guide you through the features and benefits of the Excel Data Analysis Toolpak, helping you to unlock its full potential in your projects.
Key Takeaways:
- Enhanced Analytical Capabilities: The Data Analysis Toolpak transforms Excel into a robust analytical tool with various statistical and data visualization options.
- User-Friendly Integration: Seamlessly integrates within Excel, providing tools like descriptive statistics, regression analysis, and ANOVA without the need for external software.
- Streamlined Workflow: Simplifies complex data analysis processes, making it accessible and efficient for users of all skill levels.
- Versatile Applications: Widely applicable across industries including finance, marketing, education, healthcare, and manufacturing for data-driven decision-making.
- Easy Installation: A quick and straightforward setup ensures users can enable the Toolpak and begin leveraging its features almost immediately.
Table of Contents
Introduction: Unleash the Power of Excel Data Analysis Toolpak
What is the Data Analysis Toolpak?
Imagine having a Swiss Army knife specifically for Excel; that’s essentially what the Data Analysis Toolpak is for your data. It’s an add-in that turns Excel from a simple spreadsheet program into a robust analytical tool, perfect for performing complex statistical analysis with just a few clicks.
Whether you’re dealing with sales metrics, research data, or any other type of information, this toolkit is specially designed to streamline the process and provide clarity from chaos.
The Significance of Data Analysis in Excel
Data analysis in Excel is no less than a superpower in today’s data-driven environment. Using Excel for data analysis means delving deep into datasets to unearth patterns, trends, and insights that inform better business strategies. With the immense volume of data generated daily,
Excel helps you manage and interpret this information effectively. Your findings can lead to more informed decisions, giving you and your team a competitive edge. Excel isn’t just about rows and columns; it’s about uncovering stories the data tells you, making it an indispensable tool in virtually every industry.
Installation Guide: Setting Up Your Data Analysis Sidekick
Enabling the Data Analysis Toolpak in Excel for Windows
To turn Excel into an even more powerful data analysis tool on your Windows device, enabling the Data Analysis Toolpak is a must. It’s like lifting the hood of your car and turbocharging the engine. And the best part? It’s quite simple to do. Here’s how:
STEP 1: Fire up Excel and head over to the Data tab; this is where the magic happens. Take a glance at the right end of the ribbon—do you see ‘Data Analysis’? If not, no worries, that’s why we’re here.
STEP 2: Click ‘File’, then ‘Options’.
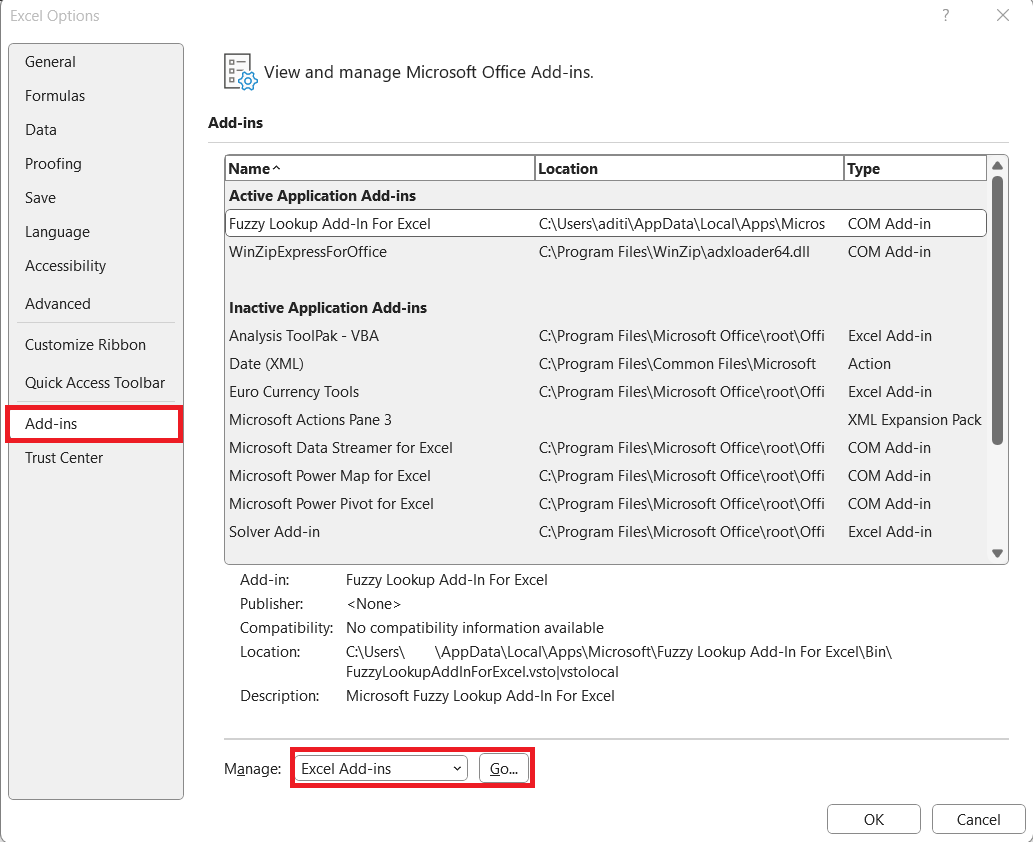
STEP 3: Select ‘Add-Ins’ and at the bottom of the window, you’ll find a Manage box; select ‘Excel Add-ins’ and click ‘Go’.
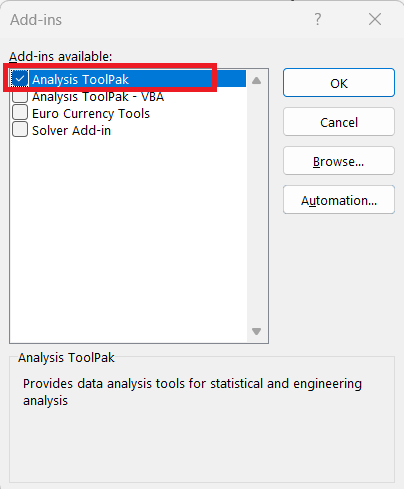
STEP 4: A checklist pops up; find ‘Analysis ToolPak’ and tick the box next to it, then hit ‘OK’.
STEP 5: Voila! The Data Analysis Toolpak is now at your disposal under the Data tab, ready to tackle those numbers like never before.
Diving Into Data: How the Toolpak Enhances Excel
Variety of Analytical Tools at Your Disposal
With the Analysis ToolPak activated, you’ve unlocked a treasure chest of analytical tools, making Excel not just your spreadsheet tool but a powerful statistical companion. Dive into:
- Descriptive Statistics: Get an immediate snapshot of your data with measures like mean, median, mode, standard deviation, and more.
- ANOVA: Unravel the mysteries of your datasets by comparing means and observing variations between groups with Analysis of Variance.
- Regression Analysis: Explore relationships between variables and forecast trends with simple linear regression or multiple regression techniques.
- t-Test: Put your sample data under the microscope to test hypotheses and validate theories with paired and two-sample t-tests.
- Histogram: Visualize the frequency distribution of your data to identify patterns and outliers in a pinch.
And that’s just a glimpse! Each tool is a key that unlocks further depth in data, providing insights and supporting decision-making with quantifiable evidence.
Real-World Applications and Use Cases
Picture this: you’re swimming in a sea of data, looking to make sense of it all. That’s when the Analysis ToolPak comes to the rescue, useful across a myriad of real-world scenarios:
- Finance and Banking: Financial analysts harness regression models to predict stock performance and evaluate investment risks.
- Marketing: Marketers utilize descriptive statistics and ANOVA to understand customer behavior, plan strategies, and track campaign effectiveness.
- Education: Researchers conduct t-tests to compare educational methods or analyze test scores between different demographics.
- Healthcare: Biostatisticians apply correlation studies to identify relationships between lifestyle factors and health outcomes.
- Manufacturing: Quality control managers rely on histograms and ANOVA to ensure product consistency and process optimization.
These are not just tools; they’re catalysts enabling industries to derive actionable insights from their data, shaping strategies that propel organizations forward.
Mastering the Features: Getting the Most Out of the Toolpak
Conducting Descriptive Statistics for Insightful Summaries
Embrace the simplicity and power of Descriptive Statistics when you need to provide a concise summary of your dataset. Think of it as a highlight reel of your data’s key attributes. Here’s what you can do:
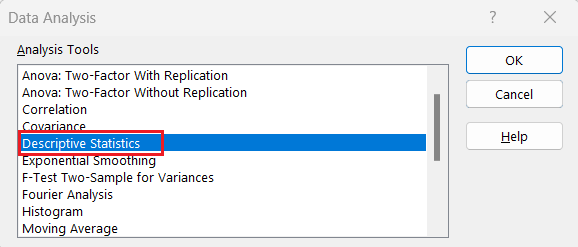
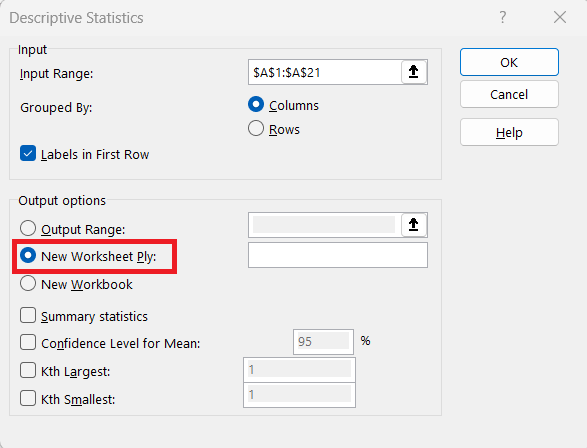
STEP 1: Begin by selecting ‘Descriptive Statistics’ from the Data Analysis Toolpak menu.
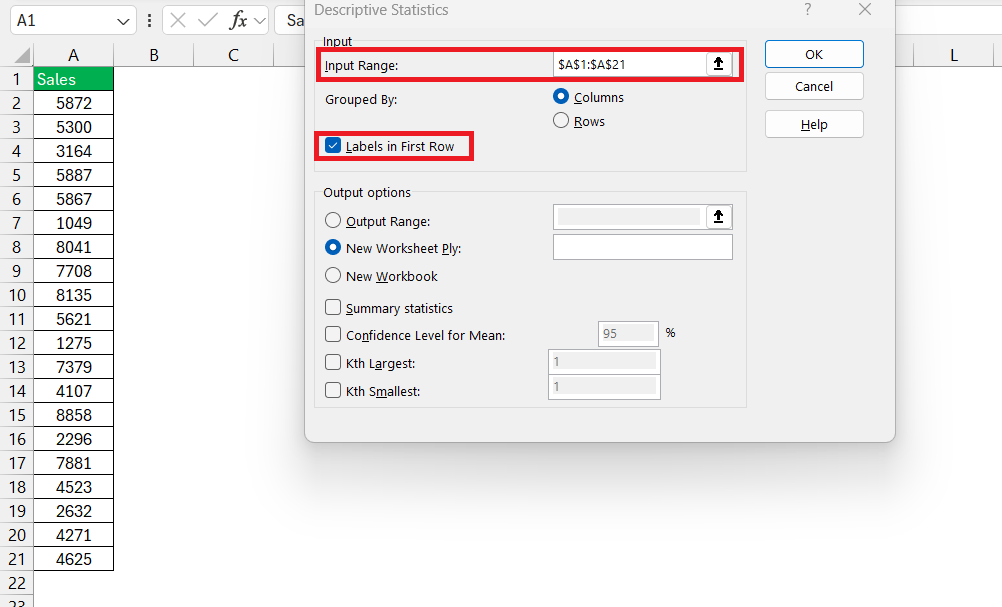
STEP 2: Select your dataset range—make sure to include ‘Labels in First Row’ if you have headings.
STEP 3: Choose an output location, preferably a new worksheet, to keep things tidy.
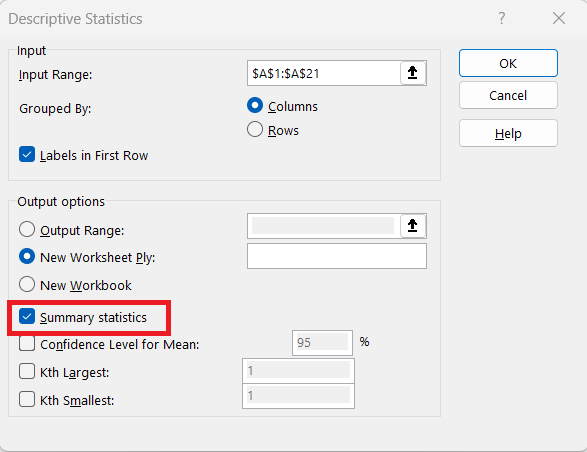
STEP 4: Check ‘Summary Statistics’ to get the mean, median, mode, range, variance, standard deviation, and more.
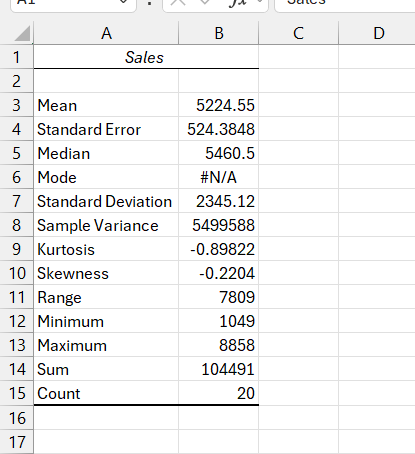
Within moments, Excel delivers a table brimming with insight, giving you the averages, the norm, the outliers, and the overall spread at a glance. It’s like having a data detective that wraps up your case neatly with all the critical points laid out.
Exploring Hypothesis Testing with T-tests and ANOVA
Hypothesis testing might sound like something out of a science lab, but with Excel’s Analysis ToolPak, you’ve got the power to conduct t-tests and ANOVA right in your spreadsheet. You can challenge your assumptions and validate your theories backed by statistical evidence.
For example:
- t-test: Allows you to compare whether two sets of data differ from each other significantly. It’s fantastic for A/B testing in marketing or examining pre and post-test scores in education.
- ANOVAs: Enable you to extend that comparison across more than two groups or variables. It’s a game-changer when you’re comparing different strategies or treatments in a business or clinical study.
These tests place hard numbers on often gut-feel judgments, providing you with the confidence that comes from data-driven conclusions.
Creating Forecasts with Moving Average and Exponential Smoothing
Forecasting isn’t just for weather stations. With the Analysis ToolPak, the Moving Average and Exponential Smoothing tools empower you to predict future trends based on your past data haze-free.
- Moving Average: Great for ironing out sharp fluctuations in your data and revealing underlying trends. It’s like looking through a clear lens to view the trajectory of your sales, inventory or customer behavior patterns.
- Exponential Smoothing: This takes it a notch higher by weighing recent data points more heavily, offering a refined and more responsive forecasting model. Think of it as your data’s memory, giving more importance to what happened recently to project what’s next.
Both tools are instrumental in crafting business strategies, stocking inventories just in time, or preparing for seasonal impacts on sales.
Advanced Tactics: Taking Your Analysis to the Next Level
Using Regression Analysis for Predictive Modeling
Unlock the future with a crystal ball called regression analysis. It’s a formidable part of your predictive modeling arsenal within Excel’s ToolPak. You can forecast sales, predict inventory requirements, and foresee market trends.
Say you want to predict next quarter’s revenue. Here’s how to get there:
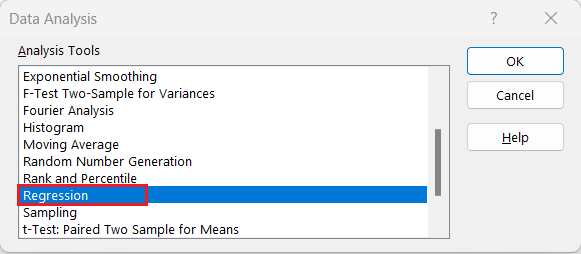
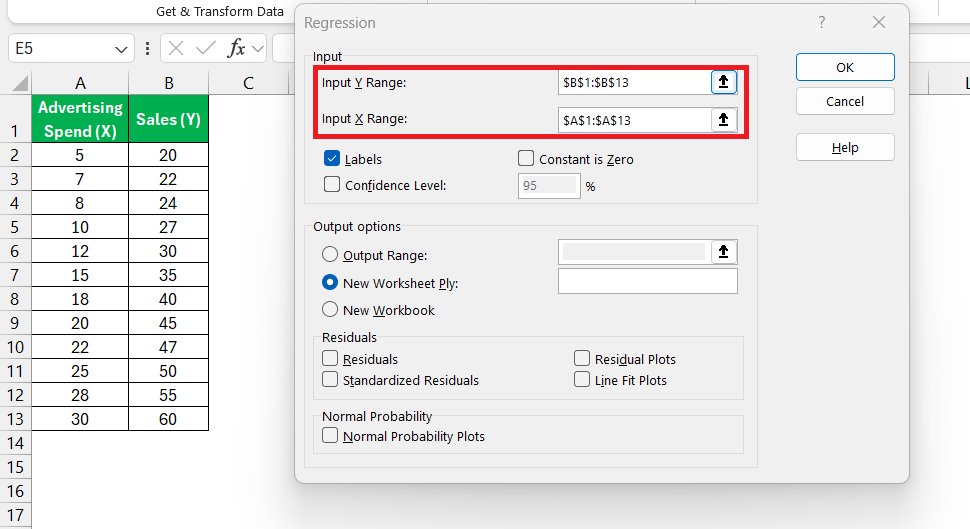
STEP 1: Select ‘Regression’ from the Analysis ToolPak.
STEP 2: Pick your dependent variable (e.g., sales) and several independent variables (ad spend, seasonality).
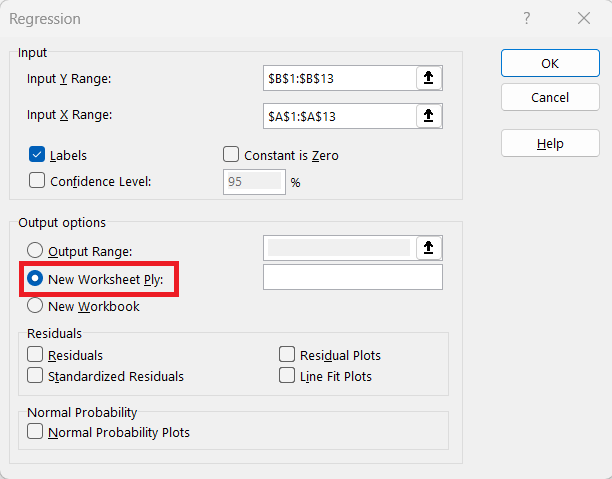
STEP 3: Decide on the output range or let Excel create a new worksheet.
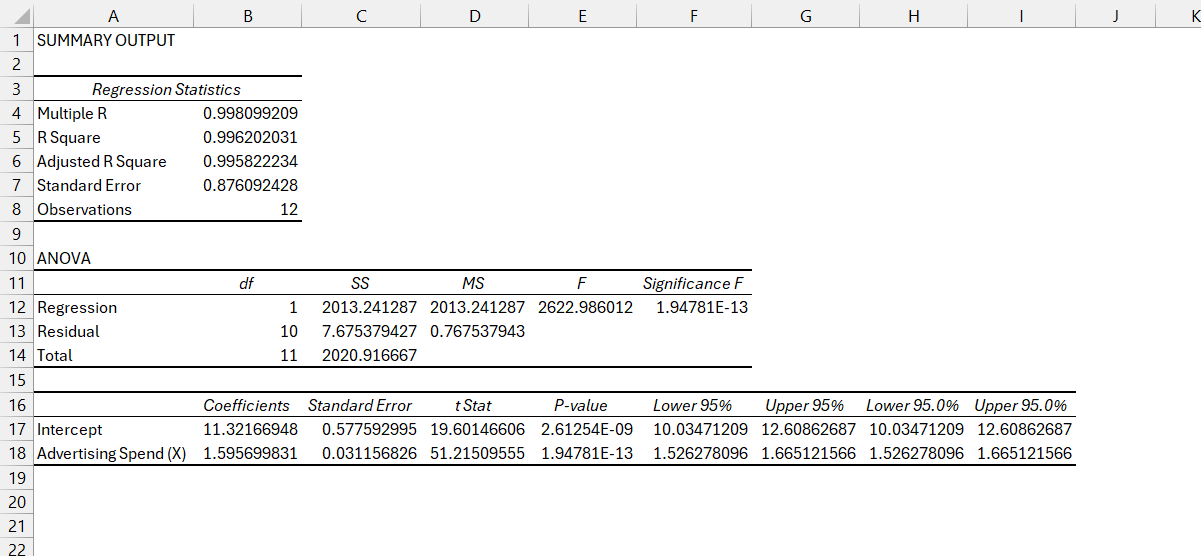
Dive into the analysis results – the coefficients show the influence of your variables on the predicted outcome.
Regression gives you a roadmap to navigate business decisions with foresight supported by historical data.
Understanding Complex Relationships with Correlation and Covariance
Ready for some detective work? When you’re looking to uncover the ties that bind different sets of data, correlation, and covariance are your go-to tools. They help you pinpoint the intricacies of these relationships, and luckily, Excel’s Data Analysis ToolPak makes complex analysis accessible.
- For Correlation Analysis: This tool helps you understand the strength and the direction of the relationship between two variables – whether they move together or inversely. You might discover, for instance, that as your marketing spend goes up, so do your sales figures.
- Covariance Analysis: This goes a step further to measure how much two variables change together. This could be vital for a portfolio manager who wants to diversify investments and mitigate risks.
By grasping these complex functions, you’ll turn raw data into strategic insights, giving them an active role in your decision-making process.
FAQ: Navigating Common Queries About the Data Analysis Toolpak
Which Excel versions support the Data Analysis Toolpak?
The Data Analysis Toolpak is a key player in the suite of features offered by Excel. You’ll find it supported in Excel 2007 and later versions, including Excel 2010, 2013, 2016, 2019, Excel for Office 365, and Excel for Mac. Whether you’re working on a Windows PC or a Mac, you can harness the power of this add-in to crunch numbers and extract insights with ease. Remember, keeping your Excel updated ensures that the Data Analysis Toolpak continues to be a trusty partner in your data analysis journey.
Can I use the Toolpak features on Excel for the web?
Currently, you can’t use the Analysis ToolPak in Excel for the web. This feature is exclusive to the Excel desktop application, where it’s fully integrated to take your data analysis to the next level. If you need the advanced statistical features of the ToolPak, you’ll have to use the desktop version of Excel on your Windows PC or Mac. Keep in mind, Excel for the web still offers a plethora of functions for your data manipulation needs, just not the full suite from the ToolPak.
What if the Data Analysis Toolpak is missing or not working correctly?
If you’re missing the Data Analysis ToolPak or it’s not functioning correctly, don’t fret. First, check ‘File’ > ‘Options’ > ‘Add-Ins’ in Excel. Confirm that ‘Analysis ToolPak’ is enabled. If it’s under ‘Disabled Items’, simply enable it. If these initial steps don’t solve the issue, you may need to repair your Excel installation. When in doubt, seeking guidance from Excel’s online support pages or active community forums can also lead to helpful solutions and get you back on the analytical track.
How do I enable data analysis tool in Excel?
To enable the Data Analysis Tool in Excel, follow these steps:
- Go to the ‘File’ tab and click ‘Options’.
- In the ‘Excel Options’ window, select ‘Add-Ins’.
- In the ‘Manage’ box at the bottom, ensure ‘Excel Add-ins’ is selected, then click ‘Go’.
- In the ‘Add-Ins’ dialog box, check the box next to ‘Analysis ToolPak’, then click ‘OK’.
- If prompted, follow the instructions to install it.
Once added, the ‘Data Analysis’ button will appear on the ‘Data’ tab, ready for all your analytical endeavors.
John Michaloudis is a former accountant and finance analyst at General Electric, a Microsoft MVP since 2020, an Amazon #1 bestselling author of 4 Microsoft Excel books and teacher of Microsoft Excel & Office over at his flagship MyExcelOnline Academy Online Course.


