Free Practice Workbook
When working with data analysis in Excel, I often need to compare the variances of two datasets to determine if they are significantly different. This is where the F-Test can be used. The F-Test is a statistical tool that helps me decide whether two samples have equal variances. It is important for further statistical testing, such as a t-test.
In this article, I’ll walk you through how to perform an F-test in Excel.
Key Takeaways:
- The F Test in Excel helps compare the variances of two datasets.
- It checks if the datasets are significantly different.
- F-Value is the ratio of the larger variance to the smaller variance
- The F test is compared to the F Critical Value.
Table of Contents
Introduction to F Test in Excel
Understanding the Basics of F-Test
To kick things off, let’s break down the F-test, a statistical analysis performed in Excel. At its core, the F-test looks at two different data sets and checks whether their variances are significantly different. Think of variance as a way to measure how spread out the data points are. It’s like comparing the consistency of two basketball players’ shots to see if one is more predictable than the other. Excel’s F-test function simplifies this comparison.
When dealing with the F-test, it’s essential to know that it’s talking about variances – not means or averages. It calculates the likelihood of a real difference between those variances rather than happening by chance. I’ll use the F-test to determine whether any observed variance is genuine or simply due to random fluctuations.
Understand the F-Test Formula
The F-Test compares the variances of two datasets using this formula:
F=Variance of Larger DatasetVariance of Smaller DatasetF = \frac{\text{Variance of Larger Dataset}}{\text{Variance of Smaller Dataset}}F=Variance of Smaller DatasetVariance of Larger Dataset
Where:
- The numerator is the larger variance.
- The denominator is the smaller variance.
- If F > F Critical, I reject the null hypothesis (variances are significantly different).
Step-by-Step Guide to use F Test
STEP 1: Enter the two datasets into separate columns in Excel.
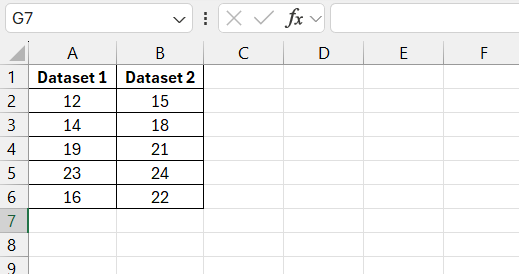
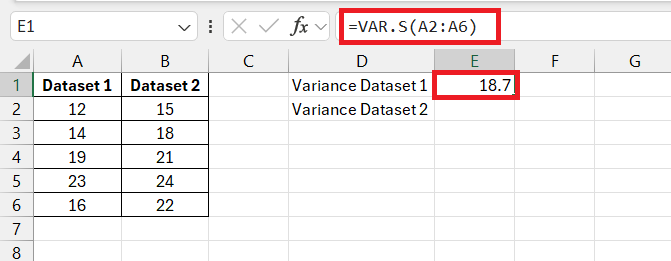
STEP 2: Calculate the Variance for Each Dataset. Since I am working with sample data, I use the VAR.S function:
Variance of Dataset 1
=VAR.S(A2:A6)
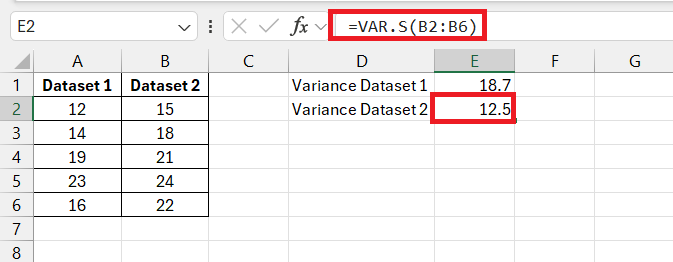
Variance of Dataset 2
=VAR.S(B2:B6)
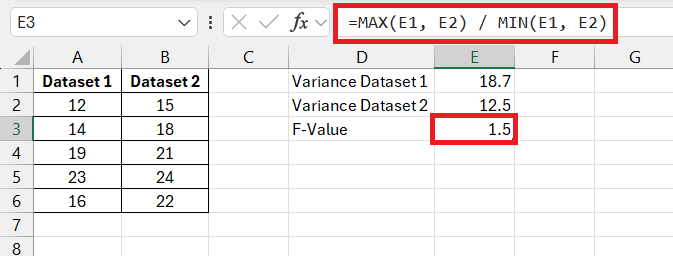
STEP 3: Calculate the F-Value. The F-Value is the ratio of the larger variance to the smaller variance:
=MAX(E1, E2) / MIN(E1, E2)
Where:
C2contains the variance of Dataset 1.C3contains the variance of Dataset 2.
STEP 4: I use the F.INV.RT function to find the critical value at a 5% significance level:
=F.INV.RT(0.05, COUNT(A2:A6)-1, COUNT(B2:B6)-1)
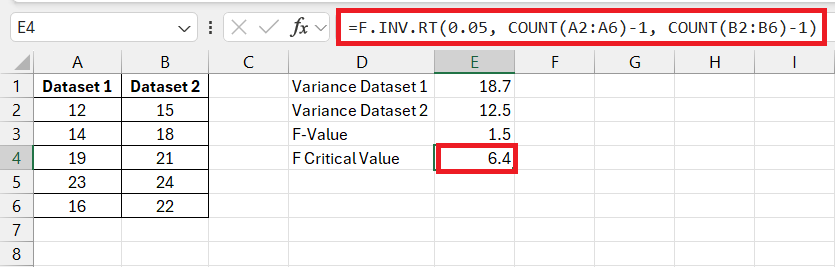
Where:
0.05is the significance level.COUNT(A2:A6)-1is the degrees of freedom for Dataset 1.COUNT(B2:B6)-1is the degrees of freedom for Dataset 2.
STEP 5: Compare the F-Value with the F Critical Value
- If F-Value > F Critical, I reject the null hypothesis (the variances are significantly different).
- If F-Value < F Critical, I fail to reject the null hypothesis (the variances are equal).
To confirm the result, I also calculate the p-value:
=F.DIST.RT(F_Value, COUNT(A2:A6)-1, COUNT(B2:B6)-1)
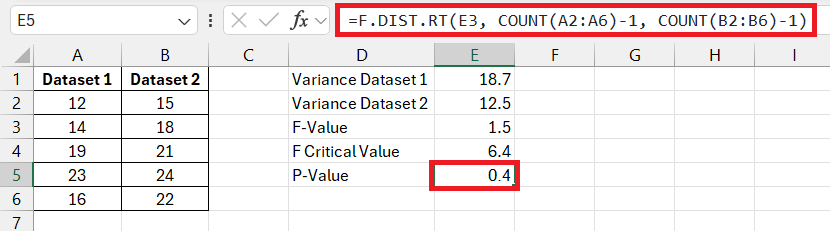
- If p-value < 0.05, I reject the null hypothesis.
- If p-value > 0.05, I fail to reject the null hypothesis.
F-Test Findings
- If the P-value is lower than the alpha level, it means the variances are significantly different. This may lead to changes in processes, strategies, or decisions.
- If the P-value is higher than the alpha level, the difference in variances is usually not important.
However, the result should be considered along with other data, experience, and business needs before making decisions.
Tips and Tricks
- #VALUE! – It usually happens when the selected data contains text or other non-numeric values.
- #N/A error – This happens when the selected ranges do not contain the same number of data points.
- Use a t-test after the F-test to compare dataset averages.
- Use Bonferroni correction or Tukey’s HSD when comparing multiple datasets.
- Create box plots to visually compare data spread.
FAQs
What Is an F-Test?
An F-test is a statistical procedure used to compare the variances across two or more samples. It is used to determine if they significantly differ from each other.
How to Compare More than Two Variances Using F-Test?
Excel’s F.TEST function is designed to compare the variances of only two datasets. You can conduct an ANOVA analysis if you want to compare more than two variances.
How to Interpret the P-Value?
The P-value from an F-test in Excel tells me the likelihood that any observed difference in variances is due to chance.
- If the P-value is less than my chosen significance level (often 0.05), it suggests the variances are significantly different.
- If the P-value is greater or equal to 0.05, the evidence isn’t strong enough to conclude that the variances differ significantly.
Are There Any Limitations to Performing an F-Test in Excel?
Yes, there are limitations to performing an F-test in Excel. The test requires data to be normally distributed and assumes that samples are randomly selected and independent of each other. Excel also cannot compare more than two variances directly with the F.TEST function.
What is the formula for the F-test?
The formula for the F-test when comparing two variances, s1 and s2, is
F = s1^2 / s2^2

John Michaloudis is a former accountant and finance analyst at General Electric, a Microsoft MVP since 2020, an Amazon #1 bestselling author of 4 Microsoft Excel books and teacher of Microsoft Excel & Office over at his flagship MyExcelOnline Academy Online Course.

 30 Days - Full Access