Then you need to edit your “Actual” graph by clicking on its series and pressing the CTRL+1 shortcut. Then within the Format box, you need to choose:
FILL: SOLID FILL & LIGHT COLOR
SERIES OPTIONS: 100% OVERLAPPED
GAP WIDTH: 60%
So, just by changing the format of the chart you can interpret the data easily.
If you try to plot Actual vs Target values in form of a Clustered Column in Excel, it will look like this:

Even though, it will get the job done it will be slow to read and difficult to interpret by the users. Comparing the right of each bar will take time and may be prone to errors.
Whereas, by just changing the format of the Clustered column we can convert it to overlay chart. Overlay Chart will help you to interpret the data at a glance.

Keep reading to learn how to overlay charts in Excel!
In the example below, we have both actual and planned sales amount for each month and you need to plot it on a graph for easy comparison.

Follow the step-by-step tutorial on how to overlay graphs in Excel and download this Excel workbook to practice along:
STEP 1: Select all the cells in the table.

STEP 2: Go to Insert Tab > In the Charts Group, click on the Clustered Column Chart icon.

A clustered column chart will appear next to the data table.
STEP 3: Click on the Plan Value Bars.

STEP 4: Right-click on the bar and select Format Data Series.

STEP 5: In the Format Data Series dialog box, select Series Overlap as 100%.

STEP 5: Under Fill Tab, Select No Fill.

STEP 6: Select Solid Line as Border, Dark Blue as Color, and 2pt as Width.

STEP 7: Right Click Actual Value Bar and Select Format Data Series.

STEP 8: Select Solid Fill and Light Blue as color.

STEP 9: Select Gridlines and Press Delete.

STEP 10: Select Chart Title and Press Delete.

Your Overlay Chart is now ready!

Table of Contents
Leveraging Overlay Charts for Enhanced Analysis
Case Studies: Real-World Applications of Overlay Charts
When it comes to bringing complex data sets to life, overlay charts are an analyst’s best friend. Through real-world applications across various industries—from finance to healthcare—these charts aid in making comparative analyses crystal clear. Look at a retail business, for instance, comparing their seasonal sales against targeted projections. An overlay chart here can vividly highlight the periods of over and underperformance, effectively guiding strategic planning.
How Overlay Charts Can Uncover Hidden Insights
Overlay charts are like detective tools for data, revealing insights that might otherwise stay buried in a sea of numbers. By layering data sets atop one another, these charts can spotlight trends, correlations, or discrepancies. For example, when analyzing website traffic, an overlay chart could uncover the connection between marketing campaigns and spikes in visitor numbers. It’s not just about seeing the data; it’s about understanding the story behind the figures.
Troubleshooting Common Issues with Overlay Charts
Identifying and Resolving Typical Problems
Working with overlay charts could sometimes test your patience, especially when the data doesn’t align as neatly as you’d hope. It’s common to encounter discrepancies in scale or issues with misaligned axes. To resolve these challenges, ensure that the data sets you’re comparing are compatible in terms of measurement units and scale. When the figures don’t match up, try adjusting the axis options or employing a secondary axis to allow for a clearer comparison. Remember, attention to the finest details is essential to make sure your overlay chart tells the accurate story.
Expert Tricks to Make Your Overlay Charts Error-Free
Dodging errors in overlay charts requires a blend of precision and creativity. Start with verifying your data for accuracy and consistency; remember that one outlier can skew an entire chart. Next, embrace the power of customization: tweak chart elements like scales, labels, and colors to enhance clarity. Also, consider using dynamic named ranges, which automatically update your chart as your dataset grows, ensuring you’re always seeing the full picture. Lastly, always preview your overlay chart before finalizing – this simple step can help catch slip-ups that are easy to miss at first glance.
FAQs: Mastering Overlay Charts Like a Pro
What Are the Essentials Needed to Create an Overlay Chart?
To create a polished overlay chart, make sure you’re set up with the essentials: Firstly, a clear objective for what you want your chart to communicate. You’ll need a dataset formatted correctly for Excel, with related data points organized in columns or rows for easy comparison. And don’t forget adequate knowledge of Excel’s chart functionalities and a dash of design sensibility to make your chart not only informative but also engaging.
What if you want to display several sets of data simultaneously?
If you’re looking to display multiple data sets together, an overlay chart in Excel is your go-to solution. It allows you to combine different chart types, like a bar and line chart, to compare various data points effectively. For instance, you could illustrate sales volume and profit margin side by side, providing a comprehensive view of performance. The key is to choose compatible chart types that complement each other and ensure your data is neatly organized for a smooth comparison.
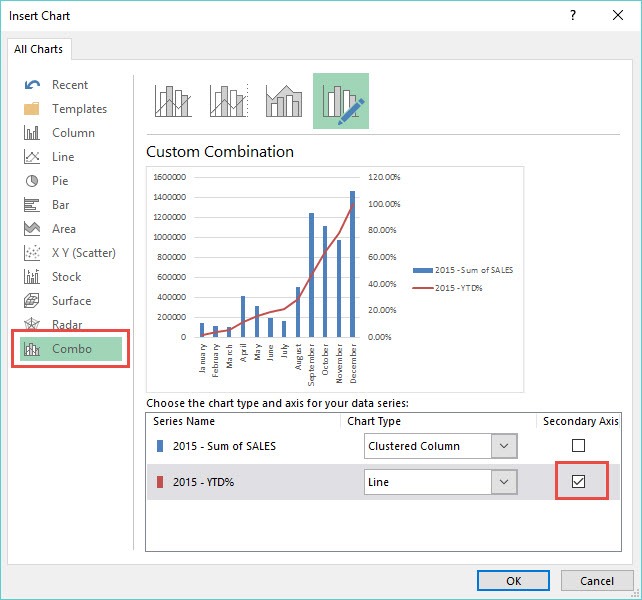
How Do I Combine Multiple Chart Types into One Overlay Chart?
Combining multiple chart types into a single overlay chart in Excel is straightforward. Start by selecting your data set and insert a basic chart that closely matches your desired output. Then, use the ‘Change Chart Type’ feature to select ‘Combo’ and customize the chart by assigning different chart types to each data series. You can pick and choose how to display each data set, such as using a line graph for trends over time and a column chart for comparisons among items. This method lets you craft a layered narrative within a single visual frame.

John Michaloudis is a former accountant and finance analyst at General Electric, a Microsoft MVP since 2020, an Amazon #1 bestselling author of 4 Microsoft Excel books and teacher of Microsoft Excel & Office over at his flagship MyExcelOnline Academy Online Course.


