Regression analysis helps you understand the relationship between variables, such as how advertising spend affects sales or how study hours impact exam scores. Excel provides built-in tools and formulas to run regression without needing advanced statistical software. In this guide, we will cover step by step how to perform regression analysis in Excel, interpret the results, and apply them to practical scenarios.
Key Takeaways
- Regression analysis measures the relationship between independent and dependent variables.
- Excel offers regression through the Data Analysis Toolpak and formulas like
LINEST. - You can calculate slope and intercept directly and generate predicted values.
- Regression helps in forecasting, trend analysis, and business decision-making.
- Power Query and VBA can extend regression workflows for automation.
Table of Contents
What is regression analysis
Regression analysis is a statistical method used to examine the relationship between one dependent variable and one or more independent variables. A simple linear regression fits a line to the data with the equation:
Y = mX + bWhere m is the slope (rate of change), b is the intercept, X is the independent variable, and Y is the dependent variable. In Excel, this can be achieved using formulas or the Analysis Toolpak.
Step by step example using the workbook
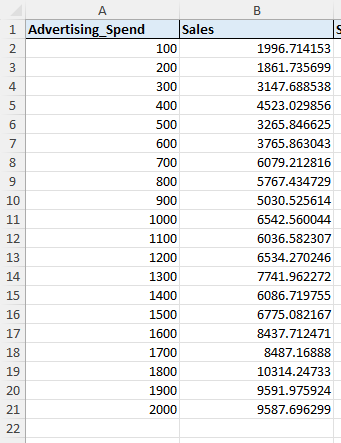
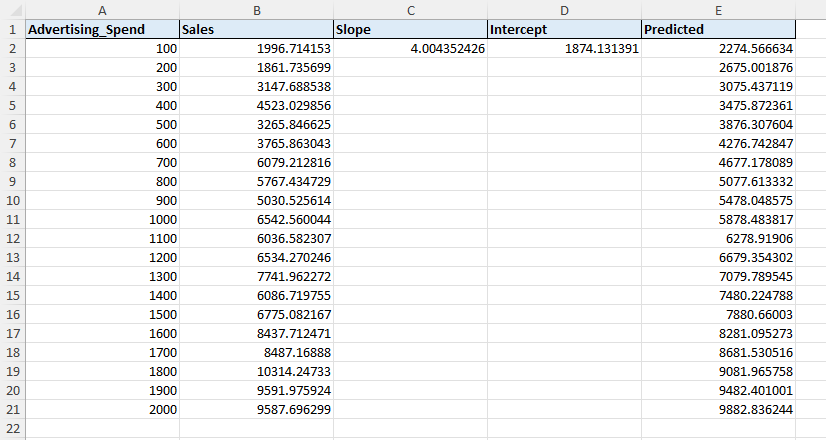
Our raw data includes Advertising Spend and Sales data.
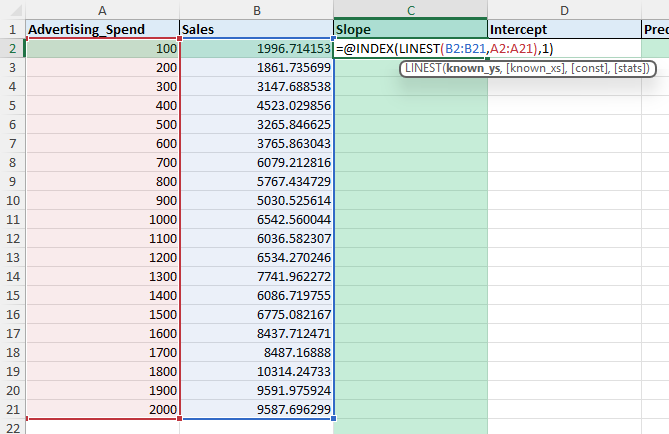
Column C calculates the slope using =INDEX(LINEST(B2:B21,A2:A21),1).
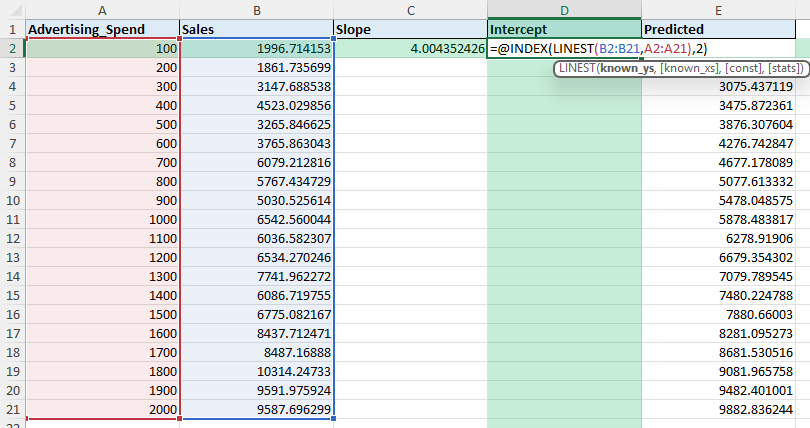
Column D calculates the intercept with =INDEX(LINEST(B2:B21,A2:A21),2).
Column E uses =Slope*X + Intercept to generate predicted values for sales.
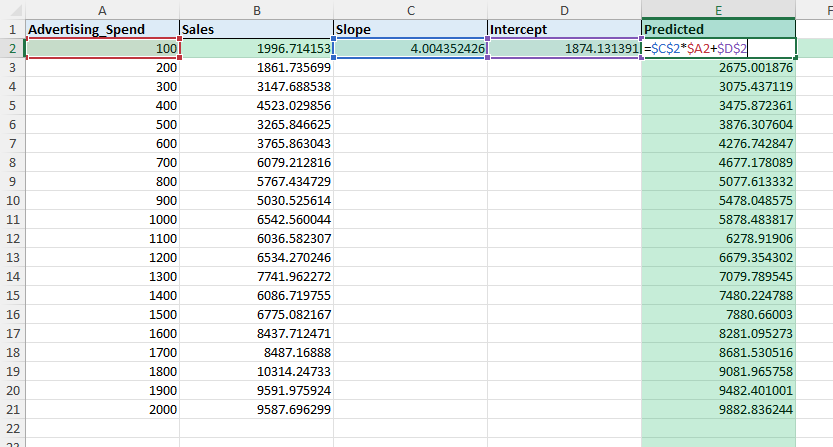
You can now see the values for the regression line applied to the dataset.
Practical formulas
Slope only:
=SLOPE(Y_range,X_range)
Intercept only:
=INTERCEPT(Y_range,X_range)
Predicted value for a given X:
=SLOPE($Y$2:$Y$21,$X$2:$X$21)*X_value + INTERCEPT($Y$2:$Y$21,$X$2:$X$21)
LINEST for full regression stats:
=LINEST(Y_range,X_range,TRUE,TRUE)
Common mistakes and tips
Toolpak not enabled: Regression option missing under Data Analysis means the Toolpak is not active. Enable it in Add-ins.
Wrong input ranges: Ensure dependent variable (Y) and independent variable (X) ranges align in length. Mismatched ranges return errors.
Forgetting intercept: Using only slope without intercept can distort predictions. Always include both unless theory justifies forcing through zero.
Overfitting: Including too many independent variables in multiple regression can create misleading results. Stick to key predictors.
Ignoring residuals: Always review residual plots to confirm linearity and constant variance assumptions.
Bonus tips and advanced scenarios
Multiple regression: Use Toolpak with multiple X ranges (e.g., Advertising, Price, Season) to model more complex outcomes.
Forecasting: Apply regression equation to future X values to predict future Y outcomes.
Power Query integration: Use Power Query to clean and structure input data before running regression, ensuring accuracy.
Use cases
Marketing performance. Estimate how additional advertising spend impacts sales and calculate expected ROI.
Why it matters: Businesses need to know whether marketing campaigns generate proportional increases in sales. Regression provides evidence for resource allocation.
How to do it: Set Advertising Spend as the independent variable (X) and Sales as the dependent variable (Y). Run regression with Toolpak or LINEST to obtain slope and intercept. The slope shows how much sales increase for each unit of advertising spend.
Practical add-on: Add ROI analysis by dividing predicted incremental sales by the additional spend. For example, if slope = 2.5, then every extra $100 in advertising predicts $250 in sales.
Benefit: Enables marketing teams to compare channels (e.g., online ads vs. TV) and optimize budgets with measurable ROI projections.
Finance forecasting. Model how revenue relates to cost drivers, such as number of clients or production scale.
Why it matters: Financial teams rely on projections to set budgets and evaluate profitability. Regression can highlight the strongest drivers of revenue growth.
How to do it: Use client count or production output as the independent variable (X) and revenue as the dependent variable (Y). In multiple regression, include both drivers to see combined effects.
Practical add-on: Create sensitivity models that simulate different client growth scenarios by plugging values into the regression equation.
Benefit: Supports accurate revenue forecasts for financial planning and allows managers to prepare strategies for both conservative and aggressive growth scenarios.
Operations. Predict production output based on machine hours or labor hours worked.
Why it matters: Operations managers must balance staffing, machine time, and expected output to meet customer demand efficiently.
How to do it: Use machine hours or labor hours as X and production output as Y. Regression will show the rate of output increase per unit of time invested.
Practical add-on: Track diminishing returns by adding quadratic or multiple variables. For example, productivity may rise with more hours but level off after a threshold.
Benefit: Helps identify optimal scheduling, prevents over-allocation of labor, and ensures production meets demand without wasted capacity
FAQ
Where is the regression tool in Excel?
It is under Data > Data Analysis > Regression once the Analysis Toolpak is enabled.
Can Excel run multiple regression?
Yes. In the Regression dialog, select multiple independent variable ranges under Input X Range.
What does R-squared mean?
R-squared measures how much of the variance in the dependent variable is explained by the independent variable(s). Values closer to 1 indicate a better fit.
Is regression available in all Excel versions?
Toolpak regression is available in desktop versions. LINEST, SLOPE, and INTERCEPT functions are also supported in most modern Excel versions.
How do I make predictions after running regression?
Use the regression equation =Slope*X + Intercept to calculate predicted values for new X inputs.

John Michaloudis is a former accountant and finance analyst at General Electric, a Microsoft MVP since 2020, an Amazon #1 bestselling author of 4 Microsoft Excel books and teacher of Microsoft Excel & Office over at his flagship MyExcelOnline Academy Online Course.


