Free Practice Workbook
Table of Contents
Averaging Percentages in Excel
Introduction
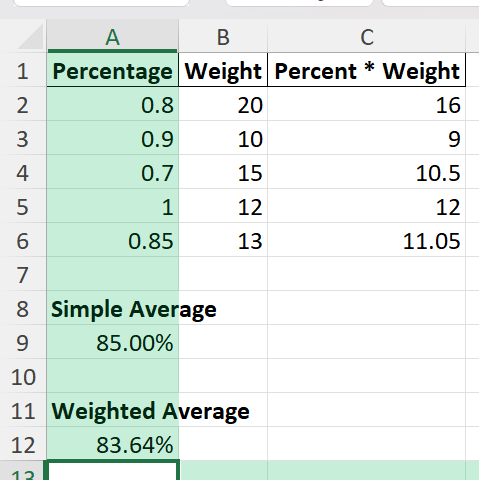
Averaging percentage in Excel is similar to averaging numbers. You can use the AVERAGE function to calculate the mean of multiple values or percentages. For example, if five students scored 80%, 90%, 70%, 100%, and 85%, the average percentage is:
=AVERAGE (80%, 90%, 70%, 100%, 85%)
= 85%
Excel adds all the percentages and divides the total by the number of values.
Types of Averages
- Simple Average – A simple average is calculated by adding all values and dividing by the number of values. It provides equal weightage to all percentages.
- Weighted Average – A weighted average assigns different weights to values before calculating the average.
How to Average Percentages in Excel
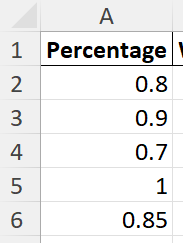
- Type the percentages in column A in decimal or percentage format.
- In a new cell, enter the AVERAGE formula:
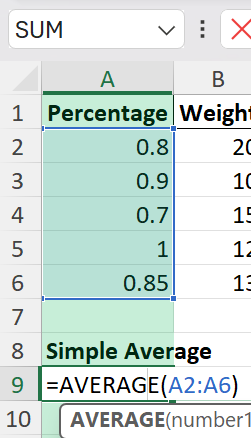
- Go to the Home tab and select the percentage symbol.
- In column B, enter your weights.
- In a new cell, multiply the percentage by weights:
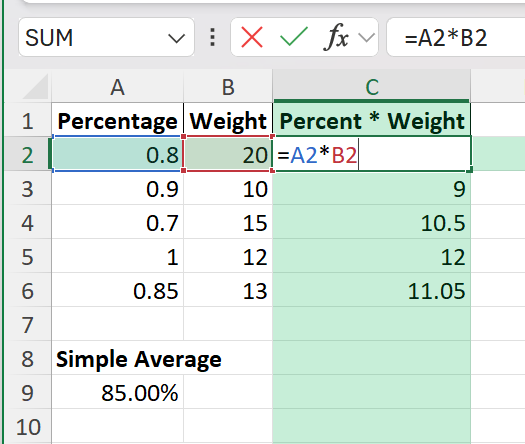
- Copy the formula down for all rows.
- For calculating the weighted average, enter this formula:
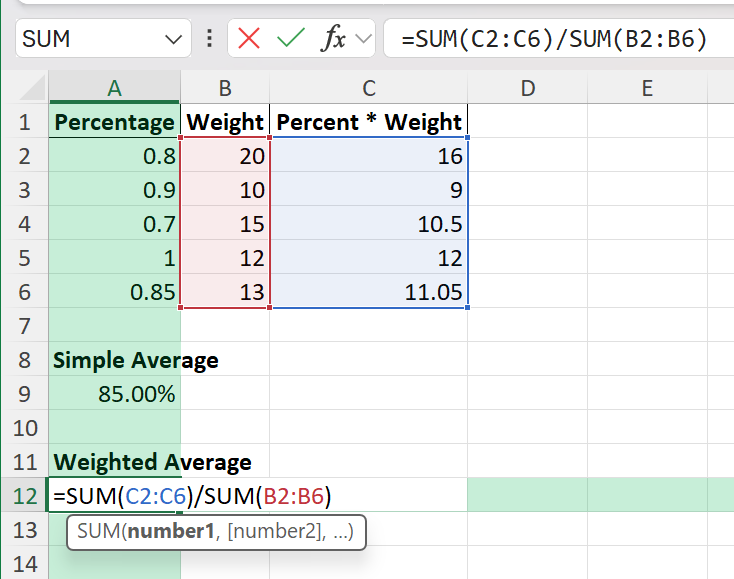
- Format the result as a percentage.
Why Averaging Percentages Can Be Tricky
Although calculating an average percentage seems straightforward, it is important to understand what the percentages represent. A simple average works well when every percentage is based on the same number of observations. However, if the percentages come from groups of different sizes, a simple average may not reflect the true overall percentage.
For example, suppose one department has a completion rate of 90% based on 100 employees, while another department has a completion rate of 70% based on only 10 employees. If you calculate a simple average, the result will be 80%. This treats both departments as equally important, even though one department is much larger than the other.
In such situations, a weighted average provides a more accurate result because it takes the size of each group into account.
Common Mistakes and Tips
- Do not average averages unless all groups have the same sample size.
- Use a weighted average when percentages represent groups of different sizes.
- Format average results as percentages to improve readability.
- Check formula ranges carefully and make sure they reference the correct cells.
- Use named ranges to make formulas easier to read and maintain.
Advanced Scenarios
VBA Macro for Weighted Average
You can use this VBA code to create a custom formula for a weighted average. Here is the code:
Function WeightedAverage(Percentages As Range, Weights As Range) As Double
    Dim i As Integer
    Dim num As Double, denom As Double
    num = 0: denom = 0
    For i = 1 To Percentages.Count
        num = num + Percentages.Cells(i) * Weights.Cells(i)
        denom = denom + Weights.Cells(i)
    Next i
    WeightedAverage = num / denom
End Function
If the data is present in range A2:A6 and B2:B6, you can use this formula:
=WeightedAverage(A2:A6, B2:B6)
FAQs
Differentiate between simple and weighted average?
A simple average gives equal importance to all values. A weighted average gives more importance to some values based on their weights.
When should I use a weighted average?
A weighted average can be used if your percentages represent different group sizes or weights.
Can the AVERAGE function work for percentages?
Yes, the AVERAGE formula works for percentages. But make sure that your data is formatted as numbers or percentages.
Can I automate this for new data entries?
Yes, use Excel Tables, Power Query, or VBA for dynamic averaging.

John Michaloudis is a former accountant and finance analyst at General Electric, a Microsoft MVP since 2020, an Amazon #1 bestselling author of 4 Microsoft Excel books and teacher of Microsoft Excel & Office over at his flagship MyExcelOnline Academy Online Course.

 30 Days - Full Access