Welcome to the world of data visualization with Microsoft Excel! In Excel, it’s not just about accuracy; it’s also about making your data easily digestible. One effective way to achieve this is by employing alternating row colors, which add both style and functionality to your spreadsheets. In this article, we will learn how to change row color in Excel –
Key Takeaways:
- Enhanced Readability: Alternating row colors transform plain data into a visually appealing tapestry, making it easier for readers to navigate and comprehend.
- Reduced Eye Fatigue: By providing a distinct visual rhythm, alternating row colors reduce the strain of analyzing dense datasets, improving user experience and efficiency.
- Quick Formatting: Excel offers multiple methods for applying alternating row colors, from quick table formatting to custom conditional formatting, catering to various preferences and needs.
- Clarity and Order: Alternating row colors bring clarity to large datasets, minimizing confusion and errors by visually separating rows and aiding in data analysis.
- Consistency and Accessibility: Tailoring colors for high contrast and utilizing Excel styles for consistent aesthetics not only improves visual appeal but also ensures accessibility for users, including those with visual impairments.
Table of Contents
Introduction to Data Visualization with Excel
The Visual Appeal of Alternating Row Colors
In Excel, data not only needs to be accurate but also presented in a way that is easy to digest. Alternating row colors add a subtle flair to your spreadsheets, transforming a plain set of rows and columns into a neatly organized data tapestry.
This method of data visualization isn’t just about style; it creates a distinct visual rhythm that guides the eye along information pathways, reducing the strain of analyzing lines and lines of data.
Enhancing Data Legibility in Spreadsheets
Perhaps you’ve experienced the eye fatigue that comes from staring at a dense spreadsheet. There’s a simple, but effective solution: enhancing data legibility by applying alternating row colors. This practice creates a visual distinction between rows, which especially comes in handy with large datasets, minimizing confusion and errors when cross-referencing.
By bringing clarity and order to your data, you’ll find it’s much easier to spot trends, identify key information, and maintain accuracy in your work.
Step-by-Step Guide to Change Row Color
Method 1: Quick Formatting with Excel Tables
If you want to format your Excel data quickly and get a professional look in no time, using Excel tables is the way to go. Here’s how they can help:
STEP 1: Open your Excel spreadsheet and select the range of cells you wish to format.

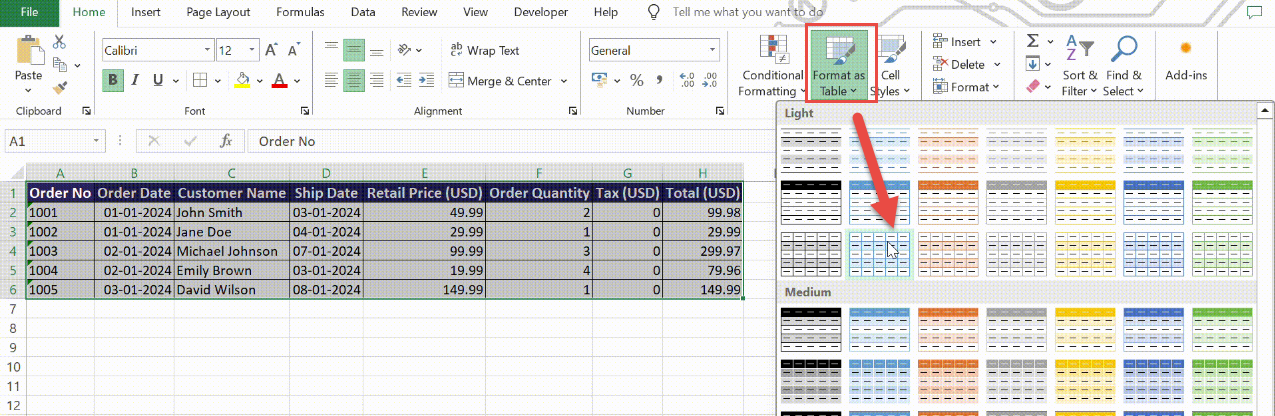
STEP 2: Navigate to the Home tab and click on “Format as Table” from the ribbon menu.

STEP 3: Choose a table style that features alternating row colors from the gallery of options.
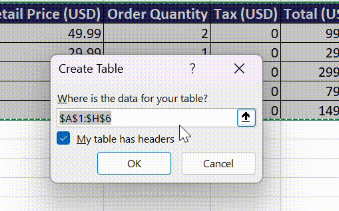
Ensure the cell range is correct in the Format as Table dialog box, then, confirm with “OK.”
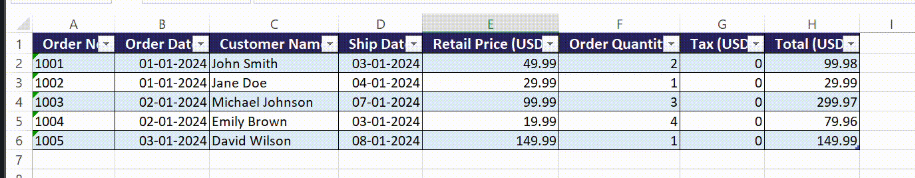
Voilà! Your data now sports a clean, organized table with alternating row styles, making it vastly more accessible for review and analysis.
Method 2: Conditional Formatting for Custom Patterns
When you desire more control over your spreadsheet’s aesthetics, conditional formatting is your ally, allowing you to create custom patterns and styles beyond the standard table settings. Here’s a quick guide:
STEP 1: Select the cell range in your spreadsheet for which you want the alternating colors.

STEP 2: Go to the ‘Home’ tab and click on the ‘Conditional Formatting‘ button in the Styles group.

STEP 3: Choose ‘New Rule…’ from the dropdown menu.

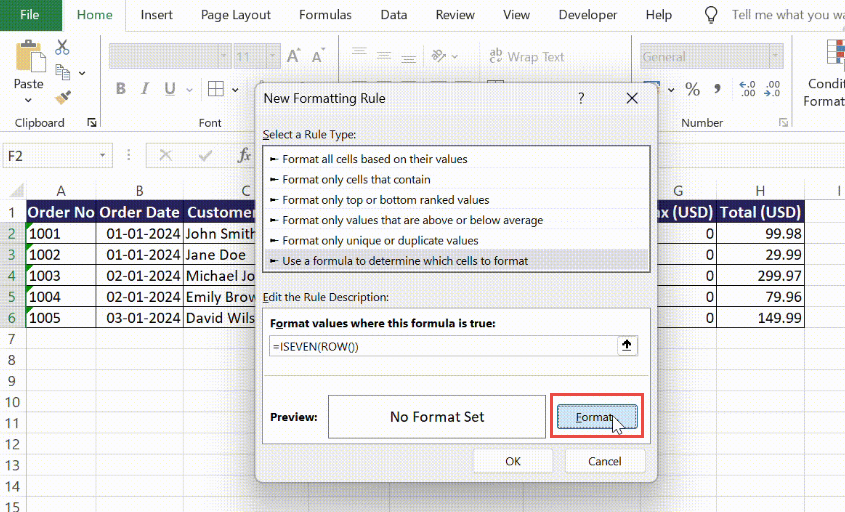
STEP 4: In the ‘New Formatting Rule’ dialog, select ‘Use a formula to determine which cells to format’.

STEP 5: Enter the formula =ISEVEN(ROW()) for even rows or =ISODD(ROW()) for odd rows.

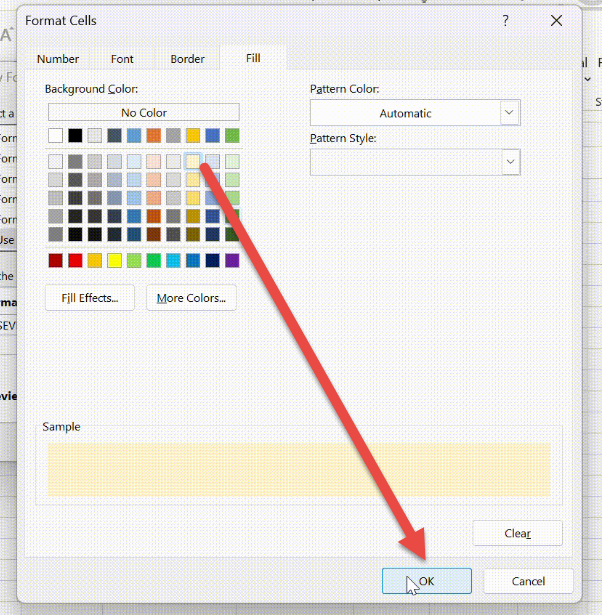
STEP 6: Click on the ‘Format’ button.
Pick your desired color for the fill and any other formatting options, then hit ‘OK’.
If needed, repeat the steps for the alternate rows with a different color.
When you’ve applied the rules, you’ll witness your chosen patterns emerge as if by magic, breathing life into rows of data. And remember, this method gives you the flexibility to restyle rows even when your dataset evolves.
Advanced Tips for Perfecting Your Excel Design
Adjusting Colors for High Contrast and Accessibility
When tailoring your Excel documents for high contrast and accessibility, color choice makes a significant impact. It’s important to opt for color combinations that provide enough contrast for easy differentiation, especially for users with visual impairments. Strive for strong differences in color between the text and background — such as dark text on a light background or the reverse.
Moreover, be mindful that some users may have color vision deficiencies. Opting for patterns or varying the row darkness can circumvent issues arising from color-based distinctions alone. Utilizing Excel’s built-in accessibility checker can highlight areas in your spreadsheet that might need adjustments for better accessibility.
Incorporating Excel Styles for Consistent Aesthetics
Creating a cohesive look across your spreadsheets enhances not just visual appeal but also cognitive recognition. Excel styles are your tool for ensuring this consistency. By predefining a style, you can apply it across various workbooks and sheets, maintaining the same color schemes and fonts, which establishes a visual identity for your data.
The benefit of sticking to a consistent style is two-fold: your data becomes instantly recognizable to those who work with it regularly, and it looks polished when presented to stakeholders. Adjusting cell styles, modifying themes, or using your custom style sets can be a real game-changer in achieving a uniform aesthetic.
Troubleshooting Common Issues with Row Highlighting
Preserving Banded Rows After Data Adjustments
When you’ve spent time perfecting your row highlights, it’s vital to ensure they stay intact after making data adjustments. Here’s a tip: when you add rows within a banded table, the alternate color formatting remains consistent. However, when you add rows to the bottom of your table or outside its borders, you’ll need to extend the table to include those new rows.
For those using conditional formatting instead of table styles, remember that formulas will automatically adjust to include newly added rows as long as they are within the range defined by the formatting rule. It’s a good idea to double-check the ‘Applies to’ range within the ‘Conditional Formatting Rules Manager’ after making structural changes to guarantee your banded rows are continuously preserved.
Copying Formatted Rows to Other Worksheets or Workbooks
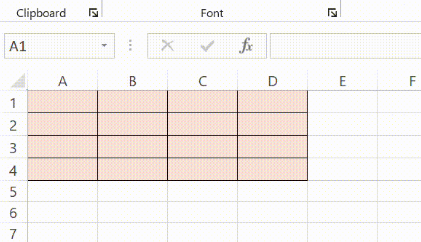
Expanding your well-formatted spreadsheet across multiple worksheets or workbooks is easily done without losing your alternating row designs. To achieve this uniformity, simply copy the formatted cells and paste them into the new location. Make sure to use the ‘Paste Special’ feature, selecting ‘Formats’ or ‘All merging conditional formats’, depending on your needs. This action preserves the conditional formatting rules, including those responsible for the banded rows, ensuring a consistent visual structure wherever your data is displayed.
To maintain alternating row designs across worksheets or workbooks:
STEP 1: Select the cells with the desired formatting.

STEP 2: Right-click and choose “Copy” or press Ctrl+C.

STEP 3: Navigate to the destination worksheet or workbook.

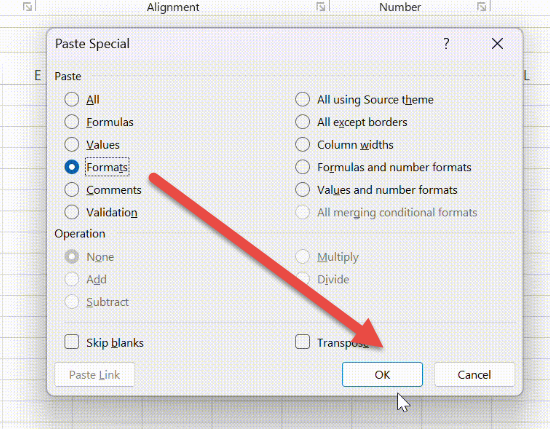
STEP 4: Right-click where you want to paste and choose “Paste Special”

STEP 5: Select either “Formats” or “All merging conditional formats” to maintain formatting integrity.
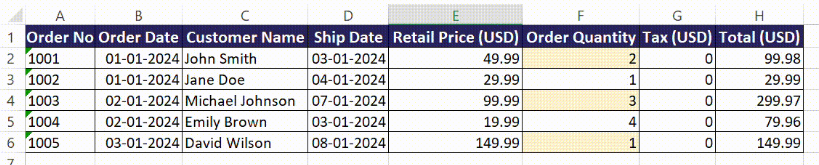
Here is your final result!
FAQ
Q1. Can I apply alternating row colors across multiple sheets simultaneously?
Yes, you can apply alternating row colors to multiple sheets simultaneously by grouping sheets together before formatting. Just select the first sheet, hold down Shift or Ctrl, and click on the other sheets you want to format. Apply the formatting to the group, and it’ll reflect across all selected sheets.
Q2. How do I maintain the alternating row color when sorting data?
To maintain the alternating row color when sorting data, ensure your rows are formatted using ‘Format as Table’ or conditional formatting that is relative to the row’s position, not the cell’s content. This way, the colors will adjust to the sort order automatically.
Q3. Is it possible to highlight every other row if my data isn’t in a table format?
Absolutely! Use conditional formatting to highlight every other row, regardless of whether your data is in a table format. Select your range and apply a formula within the conditional formatting rules to achieve the banded look.
Q4. How do I change the color of an entire row in Excel?
To change the color of an entire row in Excel, select the row by clicking on its number, then go to the ‘Home’ tab and choose the ‘Fill Color‘ button to apply your desired color. This will color the whole selected row.
Q5 .How can I alternate row colors in Excel using table settings?
To apply alternating row colors in Excel using table settings, first, highlight the cells you wish to format. Then, navigate to the “Home” tab, select “Format as Table,” and pick a table style that includes alternating row shading. This styling improves readability and offers a clear visual reference across your dataset.

John Michaloudis is a former accountant and finance analyst at General Electric, a Microsoft MVP since 2020, an Amazon #1 bestselling author of 4 Microsoft Excel books and teacher of Microsoft Excel & Office over at his flagship MyExcelOnline Academy Online Course.


