Free Practice Workbook
Microsoft Excel is commonly used for working with data and creating reports. But when you have large datasets that require advanced analysis, formulas alone can be difficult. This is where Copilot + Python in Excel can help. In this article, you will learn how to use Copilot with Python in Excel.
Key Takeaways:
- Copilot can create Python code in Excel.
- Python helps with advanced data analysis.
- You can create charts and visualizations with Python.
- Copilot can help find outliers and trends.
- Always check the code before you use it.
Table of Contents
Introduction to Copilot + Python
What is Python in Excel?
Python in Excel allows you to write and run Python code inside Excel. There is no need to switch between the two applications. Python includes libraries such as:
- pandas for cleaning and organizing data
- NumPy for calculations
- Matplotlib for charts
- seaborn for visualizations
- scikit-learn for machine learning
With the help of these tools, you can easily perform advanced analysis in Excel.
What is Copilot?
Copilot is an AI assistant in Excel that writes the Python code for you. You can describe what you want in simple language, and it will write the Python code.
This can be useful if you want to use Python but do not want to write every line of code manually.
How to Use Copilot with Python in Excel
Step-by-Step Guide
Follow the steps below to use Copilot + Python to perform salary distribution:
STEP 1: Open the Excel workbook.
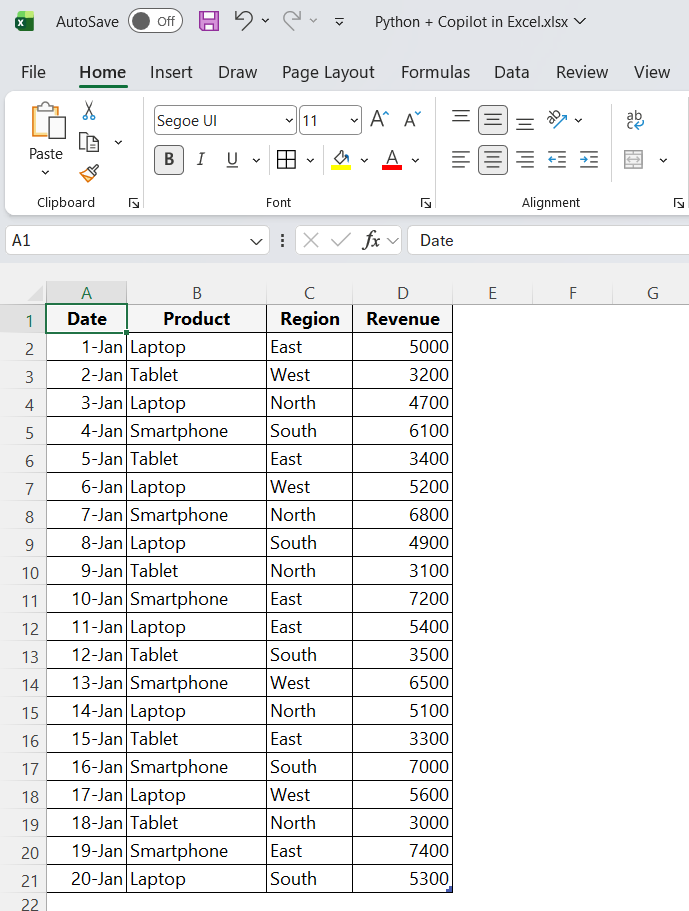
STEP 2: Go to the Home tab and select Copilot.

STEP 3: Enter this prompt:
“Use Python to analyze salary distribution by department.”
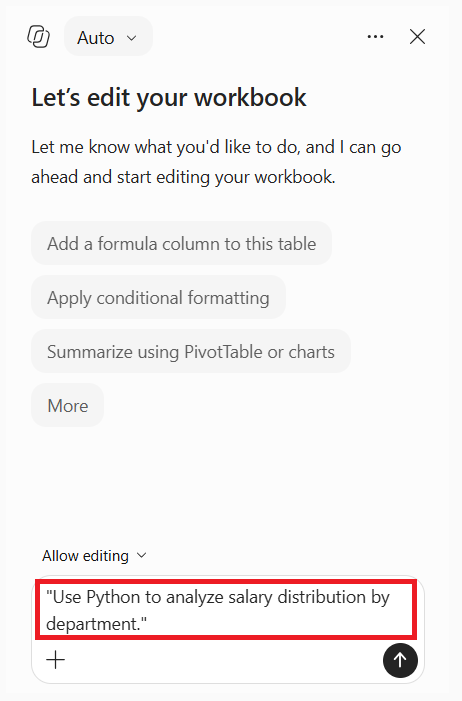
Copilot will create a DataFrame and show a preview of the result.
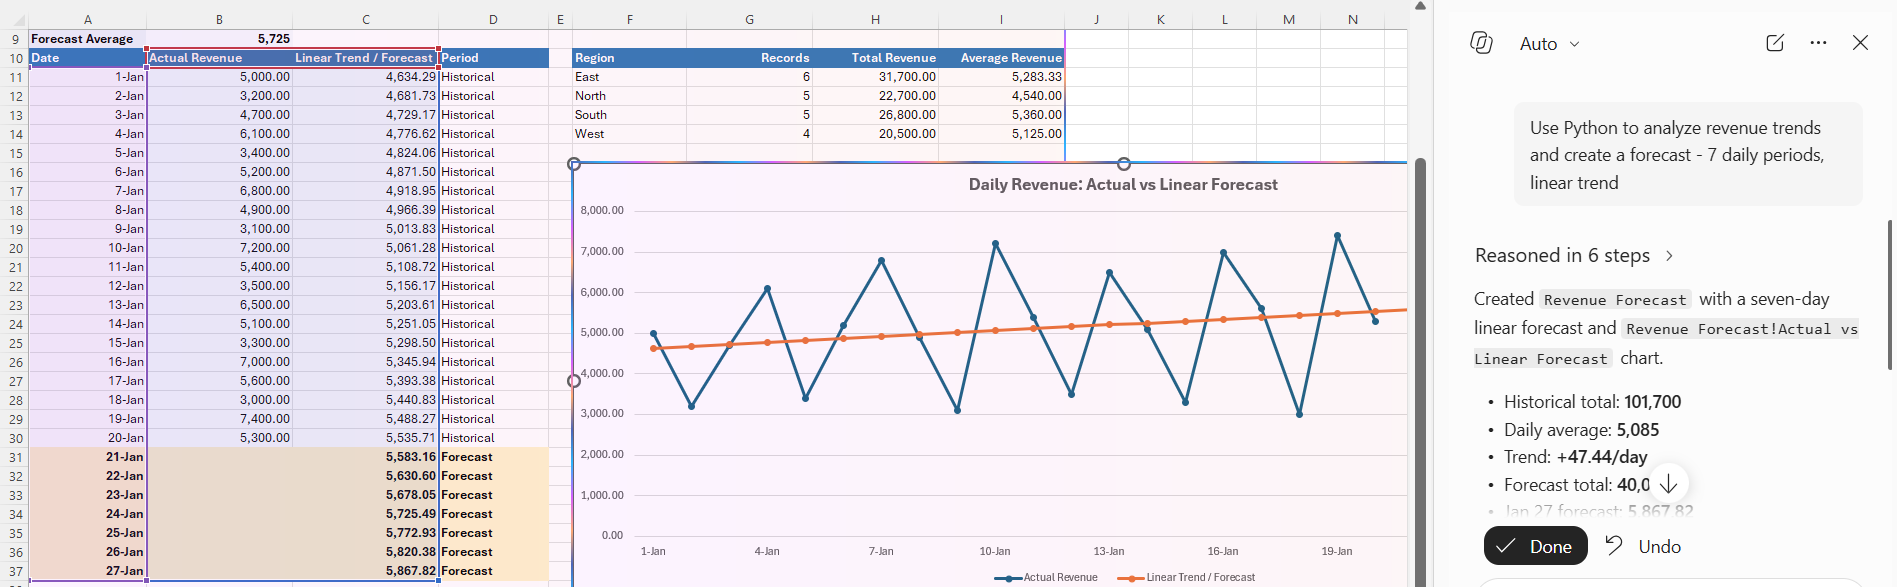
Make sure to review the output carefully.
More Copilot + Python Examples
Box Plot
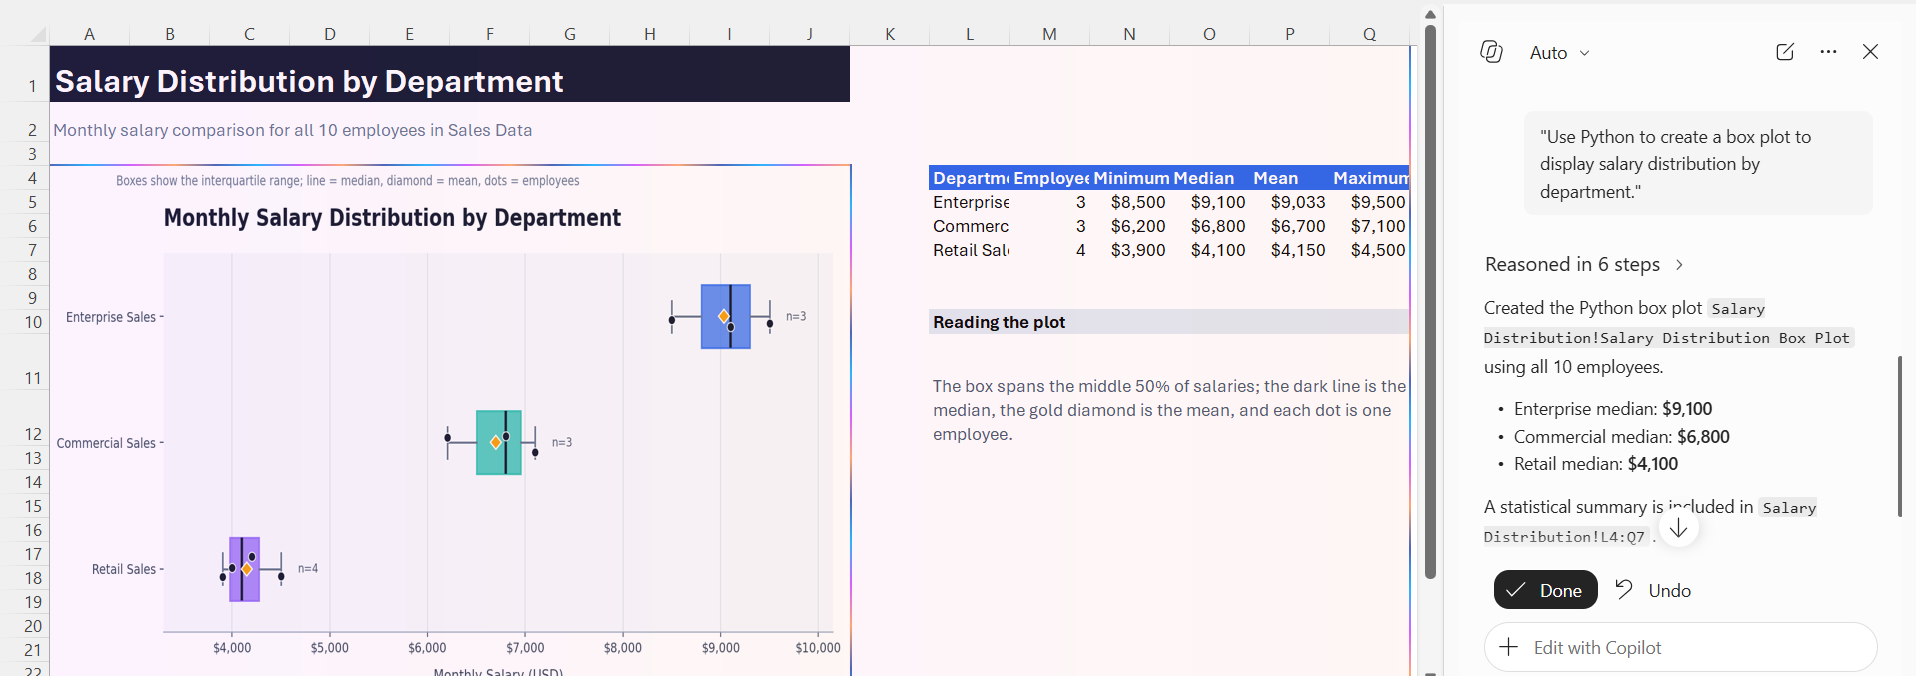
A box plot is a visual graph that shows how numerical data is spread out. You can enter this prompt to create a box plot:
“Use Python to create a box plot to display salary distribution by department.”
Find Outliers
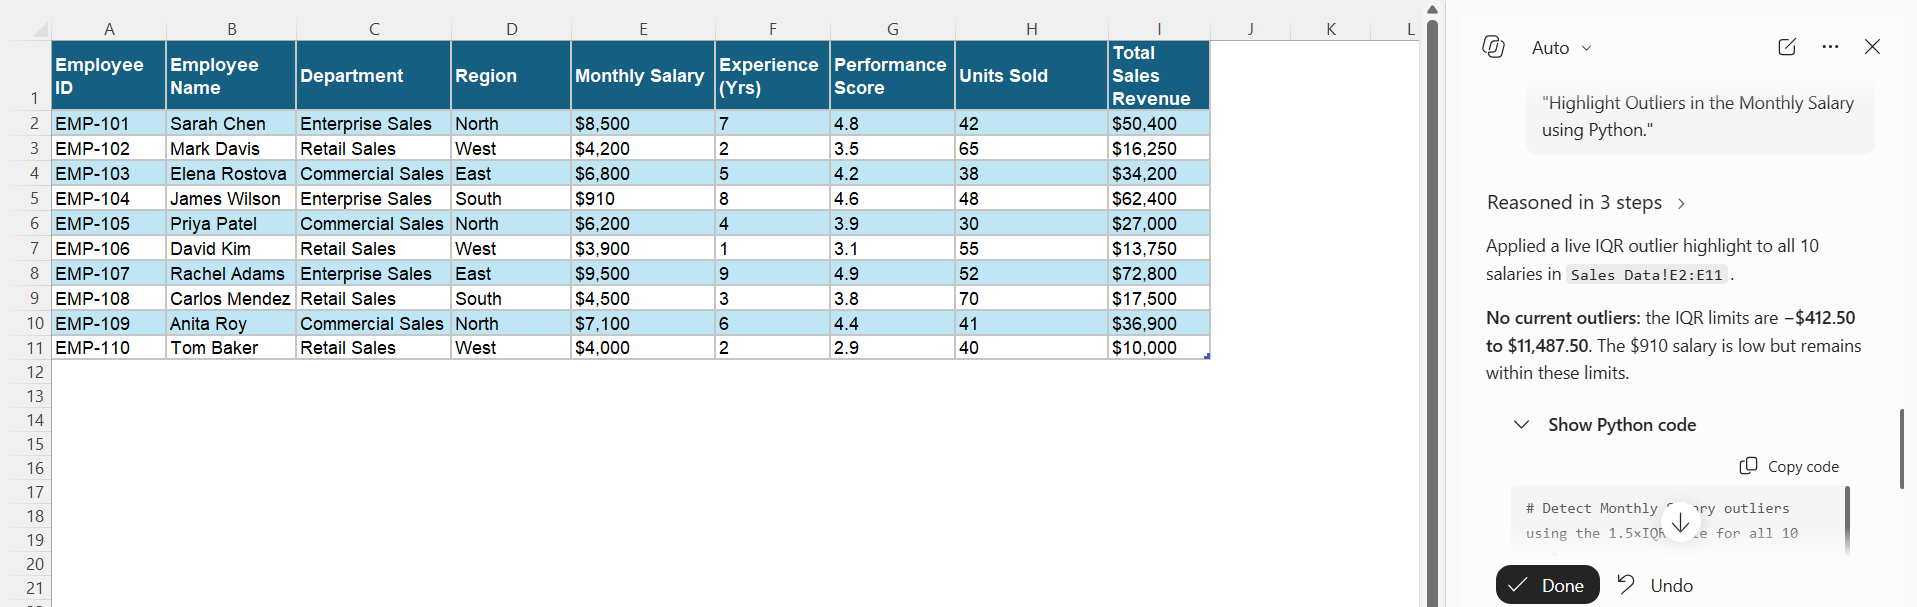
You can use Python to identify unusual values by using this prompt:
“Highlight Outliers in the Monthly Salary using Python.”
Create a Correlation Analysis
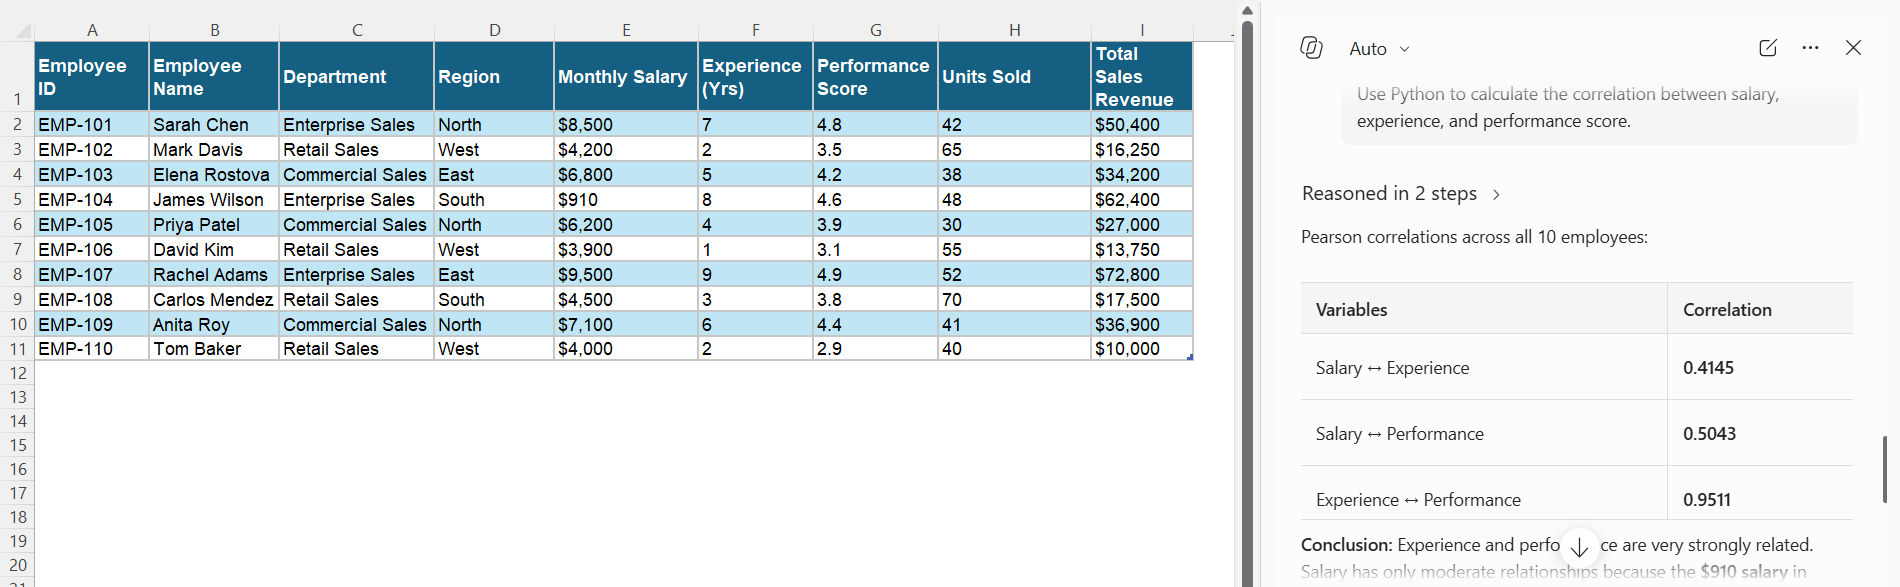
You can use Python to examine relationships between numerical columns.
Prompt: “Use Python to calculate the correlation between salary, experience, and performance score.”
Perform Clustering
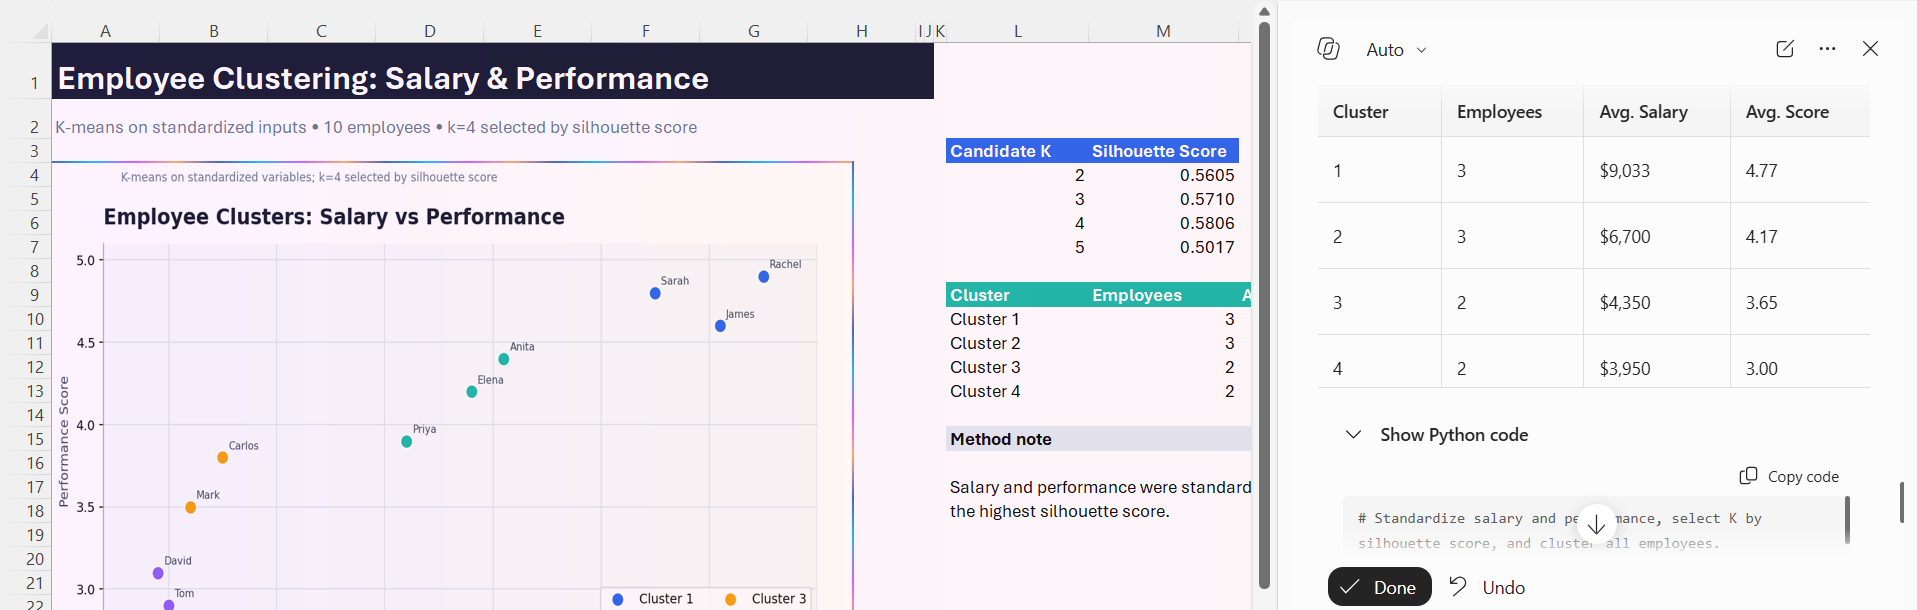
Python can also perform machine learning tasks such as clustering. Use this prompt to perform clustering:
Cluster employees based on salary and performance score using Python.
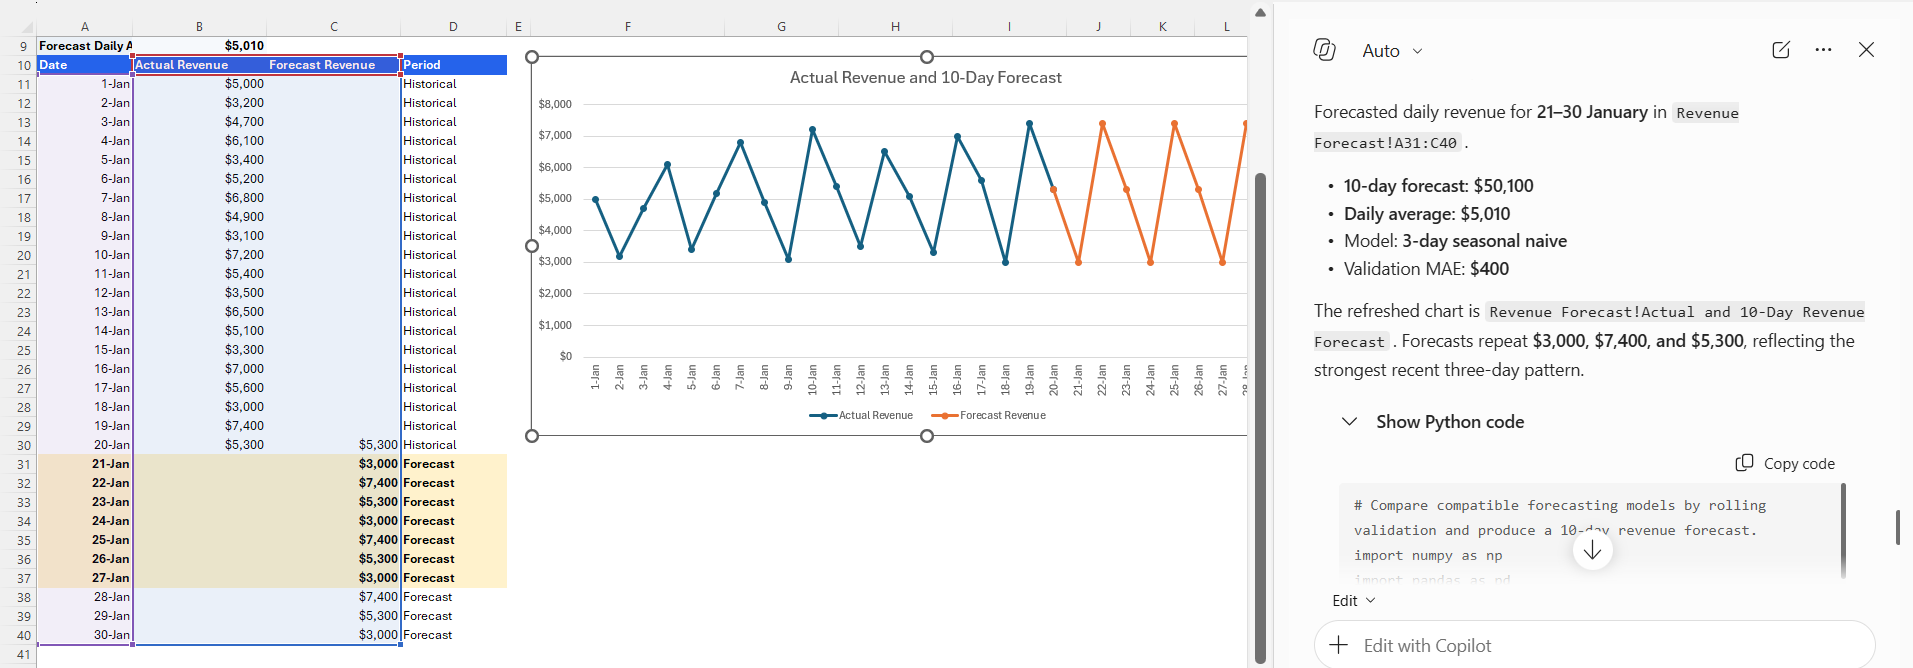
Create a Forecast
If your dataset contains time-based information, you can ask Copilot to perform forecasting by using this prompt:
Use Python to forecast monthly sales for the next six months.
Create a Chart
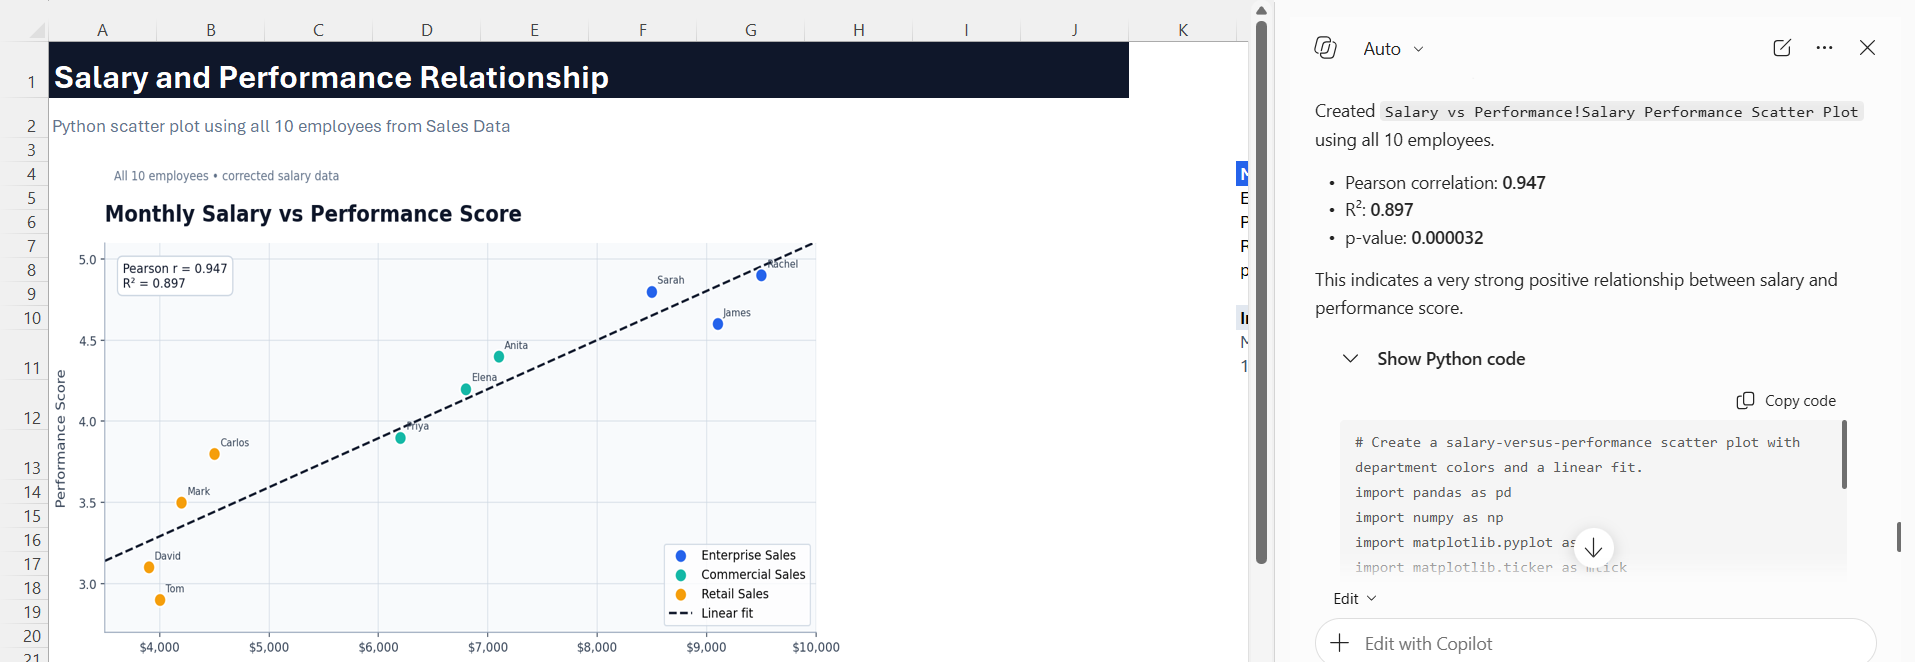
You can ask Copilot to create Python-based visualizations:
Create a scatter plot showing the relationship between sales and profit using Python.
Tips & Tricks
- You should convert data into an Excel table before using Copilot.
- You should add proper column headers for the table.
- Make sure that the prompts are specific.
- Review the Python code created by Copilot before you use it.
FAQs
1. What is Python in Excel?
Python inside Excel allows you to write and run Python code.
2. Can Copilot write Python code in Excel?
Yes, Copilot can write Python code based on the prompts you type.
3. What can you do with Copilot + Python in Excel?
You can create charts, find outliers, calculate correlations, perform clustering, and analyse data.
4. Do I need to know Python to use Copilot in Excel?
No. Copilot can write the Python code for you. However, understanding basic Python and data analysis can help you review the results.
5. Should I check the Python code created by Copilot?
Yes. Review the code and results to make sure the analysis is correct and matches your requirements.

John Michaloudis is a former accountant and finance analyst at General Electric, a Microsoft MVP since 2020, an Amazon #1 bestselling author of 4 Microsoft Excel books and teacher of Microsoft Excel & Office over at his flagship MyExcelOnline Academy Online Course.

 30 Days - Full Access