Free Practice Workbook
When looking at yearly sales data, you may not be able to draw any conclusions. Percentage difference tells you more than a raw number does. Instead of calculating the difference outside the Pivot Table, you can compare each year’s value with the previous year and display the percentage. In this article, you will learn how to show the percentage of difference from previous years with Excel Pivot Tables.
Key Takeaways:
- Percent Difference From compares each value with the previous item in a Pivot Table field.
- It automatically calculates year-over-year growth percentages.
- The first item has no previous value, so Excel displays it as blank.
- The calculation updates automatically whenever the Pivot Table is refreshed.
- Percentage formatting makes the results much easier to interpret.
Table of Contents
How to Show The Percent of Difference From Previous Years With Excel Pivot Tables
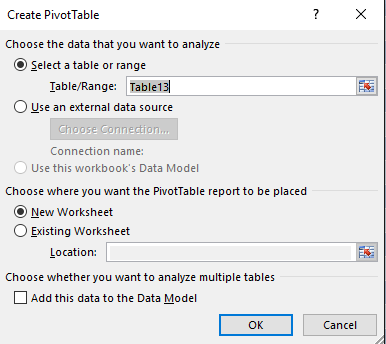
STEP 1: Insert a new Pivot table by clicking on your data and going to Insert > Pivot Table > New Worksheet or Existing Worksheet
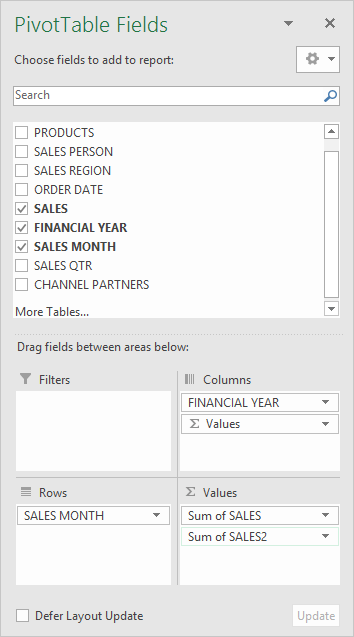
STEP 2: In the ROWS section put in the Sales Month field, in the COLUMNS put in the Financial Year field and in the VALUES area you need to put in the Sales field twice, I explain why below:
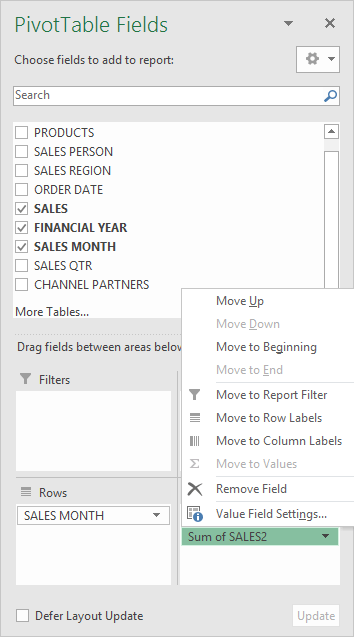
STEP 3: Click the second Sales field’s (Sum of SALES2) drop down and choose Value Field Settings
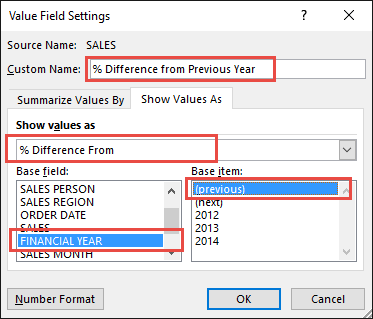
STEP 4: Select the Show Values As tab and from the drop down choose % Difference From. Select Financial Year as the Base Field, and (previous) as the Base Item. This means that we will compute the difference with the previous years in percentage terms.
Also change the Custom Name into % Difference from Previous Year to make it more presentable. Click OK.
STEP 5: Notice that the % Difference from Previous Year data is in a decimal format that is hard to read:
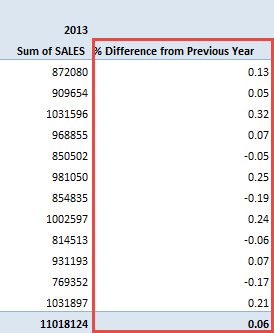
To format the % Difference from Previous Year column, click the second Sales field’s (% Difference from Previous Year) drop down and choose Value Field Settings.
The goal here is for us to transform numbers from a decimal format (i.e. 0.23), into a percentage format that is more readable (i.e. 23%).
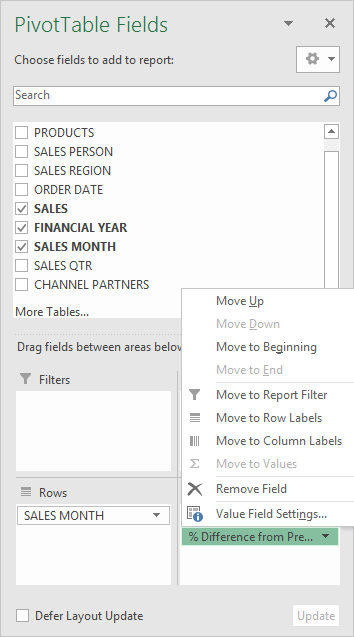
STEP 6: Click the Number Format button.
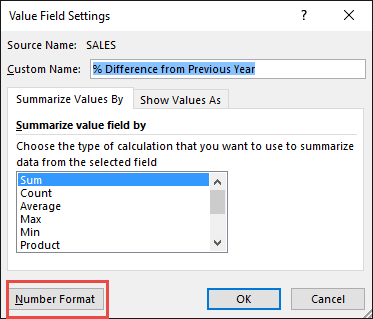
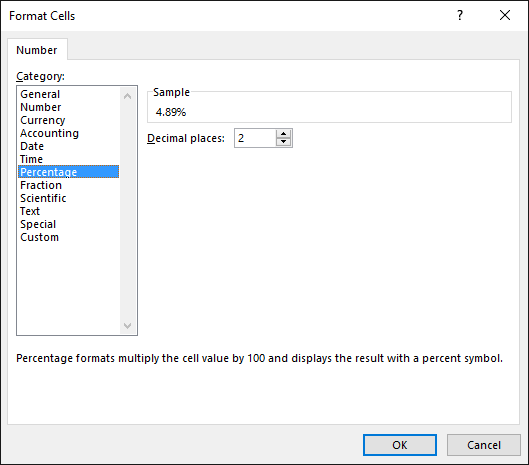
STEP 7: Inside the Format Cells dialog box, make your formatting changes within here and press OK twice.
In this example, we used the Percentage category to make our % Difference from Previous Year numbers become more readable.
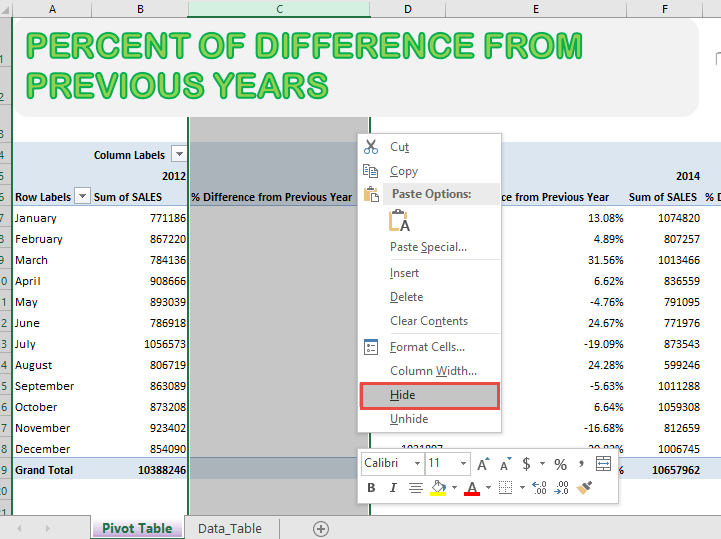
STEP 8: Right click on the columns with the empty columns and click Hide. These columns are empty because there are no previous values it can compare values on. For example the Year 2012 is the first year and has no previous year to compare to.
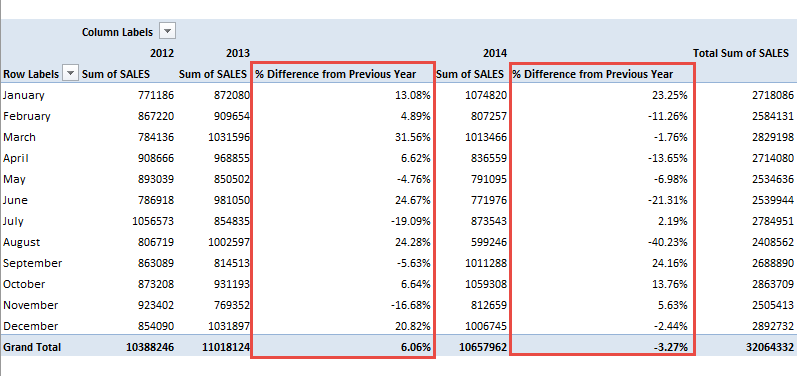
You now have your Pivot Table, showing the % Difference from Previous Year for the sales data of years 2012, 2013, and 2014.
You can see that each red box is the percentage of difference computed against the previous year (i.e. Year 2013 vs Year 2012, and Year 2014 vs Year 2013).
Frequently Asked Questions
How do I calculate the percent difference from previous years in a Pivot Table?
To calculate the percent difference, right-click on any value in the Pivot Table, select Show Values As, then choose % Difference From. Set the Base Field to “Year” and the Base Item to the previous year for comparison.
Why is my percent difference calculation showing errors or incorrect values?
Ensure that your data includes a proper time-based field (like “Year”) and is sorted in ascending order. If some years are missing data, Excel may not calculate the difference correctly.
Can I compare percentage differences for multiple years at once?
Yes, you can compare multiple years by ensuring all years are included in the Base Field. Excel will calculate the percentage difference for each year relative to the previous one.
How can I format the percentage difference results for better readability?
Select the column displaying the percentage differences, go to the Home tab, and apply Percentage Formatting to make the results clear and easy to interpret.
Can I use the percent difference calculation with other fields besides years?
Yes, you can apply the % Difference From function to other fields, such as quarters or months, by selecting a different Base Field like “Month” instead of “Year.”


Bryan
Bryan Hong is an IT Software Developer for more than 10 years and has the following certifications: Microsoft Certified Professional Developer (MCPD): Web Developer, Microsoft Certified Technology Specialist (MCTS): Windows Applications, Microsoft Certified Systems Engineer (MCSE) and Microsoft Certified Systems Administrator (MCSA).
He is also an Amazon #1 bestselling author of 4 Microsoft Excel books and a teacher of Microsoft Excel & Office at the MyExecelOnline Academy Online Course.

 30 Days - Full Access