Standard Deviation is a statistical measure that is crucial in interpreting data variability. Excel is a vital tool for data analysis, allowing users to glean useful insights from raw data. In this blog post, we will look at how to use Standard Deviation in Excel to acquire deeper insights and make more educated judgments –
Let’s look at each one of these!
Download the Excel Workbook below to follow along and understand how to calculate Standard Deviation in Excel –
Definition of Standard Deviation
Standard Deviation is used to quantify the degree of variation or dispersion in a set of data values. It determines how far off the data points are from the mean value.
Because the standard deviation is expressed in the same unit as the original data set, it can be used to comprehend the spread of values and the degree of variability in a dataset. A lower standard deviation implies that the data points are closer to the mean, whereas a higher standard deviation shows that the data points are further apart from the mean.
The standard deviation is frequently used in many fields including statistics, finance, science, social sciences, etc. It is mainly used to analyze and understand data sets and make demographic generalizations.
Let us look at an example to understand the concept better. We have sales for the last 12 months listed below. Using standard deviation, we want to know if the monthly were consistent or had dispersion.

The standard deviation of the monthly sales is around 24. It tells us the monthly sales are not more than 140 points away from the mean i.e. they are pretty consistent. If it was greater, it would indicate that the sales are quite volatile and not steady.
Formula of Standard Deviation

Where:
- x represents each value in the data set.
- μ represents the mean of the data set.
- Σ represents the summation symbol, which means adding up all the values.
- N represents the total number of values in the data set.
- √ represents the square root of the value.
The formula for calculating the standard deviation can be broken down into several steps:
STEP 1: Calculate the mean (average) of the data set by adding up all the values in the data set and dividing the sum by the total number of values.
= (139+180+171+100+136+115+179+149+162+146+135+140)/12
= 146
STEP 2: Subtract the mean (i.e. 146) from each data point.
139 -146, 180-146, 171-146, 100-146, 136-146,115-146,179-146, 149-146, 162-146, 146-146, 135-146, 140-146
-7, 34, 25, -46, -10, -31, 33, 3, 16, 0, -11, -6
STEP 3: Square the differences obtained in STEP 2.
-7^2, 34^2, 25^2, -46^2, -10^2, -31^2, 33^2, 3^2, 16^2, 0^2, -11^2, -6^2
49, 1156, 625, 2116, 100, 961, 1089, 9, 256, 0, 121, 36
This is done to make all the differences positive and preserve the magnitude of the differences.
STEP 4: Calculate the average of the squared differences.
= (49+1156+625+2116+100+961+1089+9+256+0+121+36)/12
= 543
STEP 5: Take the square root of the average squared difference.
=√543
=24
The square root of the average squared difference gives you the standard deviation i.e. 24.
Standard Deviation of Sample vs Population
The primary distinction between sample standard deviation and population standard deviation is the data collection from which they are calculated and the function they serve:
Standard Deviation of Sample:
- When you have a subset of a larger population and want to estimate the variability within that subset, you utilize sample standard deviation (s).
- It is derived from a subset of data points drawn from a broader population.
- It is an unbiased estimator, which means that the sample standard deviation is equal to the population standard deviation on average.
Standard Deviation of Population:
- When you have data for the complete population and wish to assess the exact variability within the population, you utilize population standard deviation (σ).
- It is derived from the entire set of data points in a population.
- The true variability within a population is represented by the population standard deviation, which is commonly expressed as “σ”.
- It is a more precise statistic than sample standard deviation since it takes into account all of the data in the population.
Calculating Standard Deviation in Excel
Excel provides convenient functions to compute the standard deviation effortlessly. Here are two popular methods:
- STDEV.P calculates the standard deviation of an entire population.
- STDEV.S estimates the standard deviation of a sample from a larger population.
Here we have the test scores of Math and English for a set of students. This is our entire cohort of students hence we will be using the standard deviation of population formula.
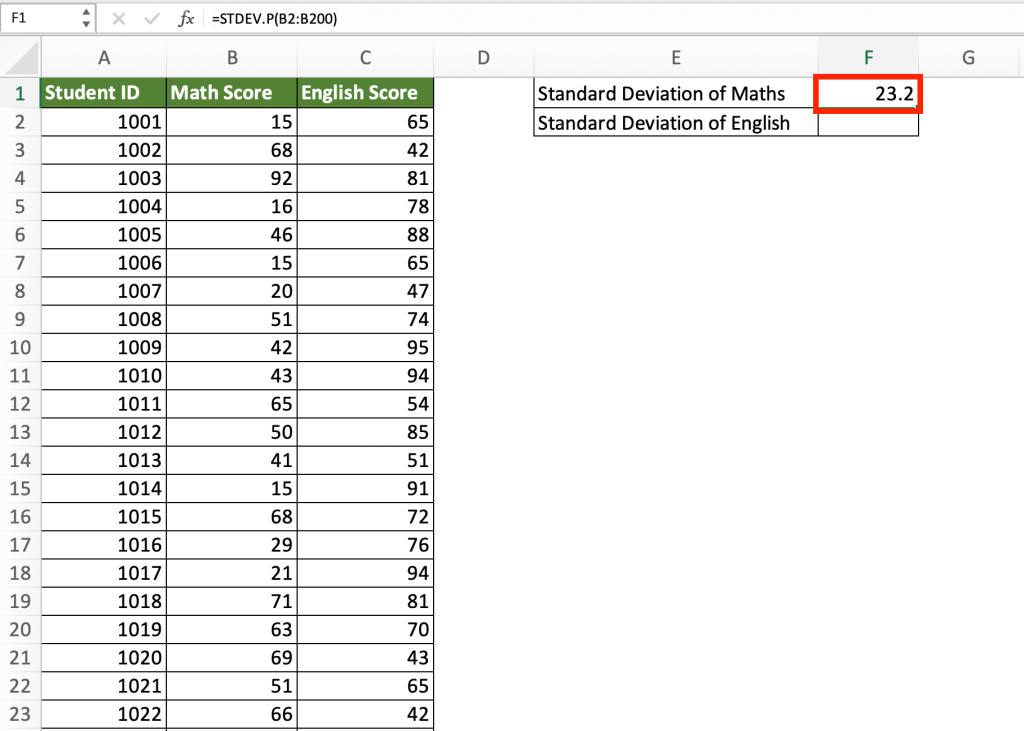
STEP 1: In the cell F1, enter the formula =STDEV.P(
STDEV.P is the Excel function for population standard deviation.

STEP 2: Select the range for our calculation. Here, we are first calculating the standard deviation in the marks for math.

STEP 3: Press Enter. Excel will calculate the standard deviation of scores allotted in Math i.e. 23.2.
Similarly, we have also calculated the standard deviation in marks for English.
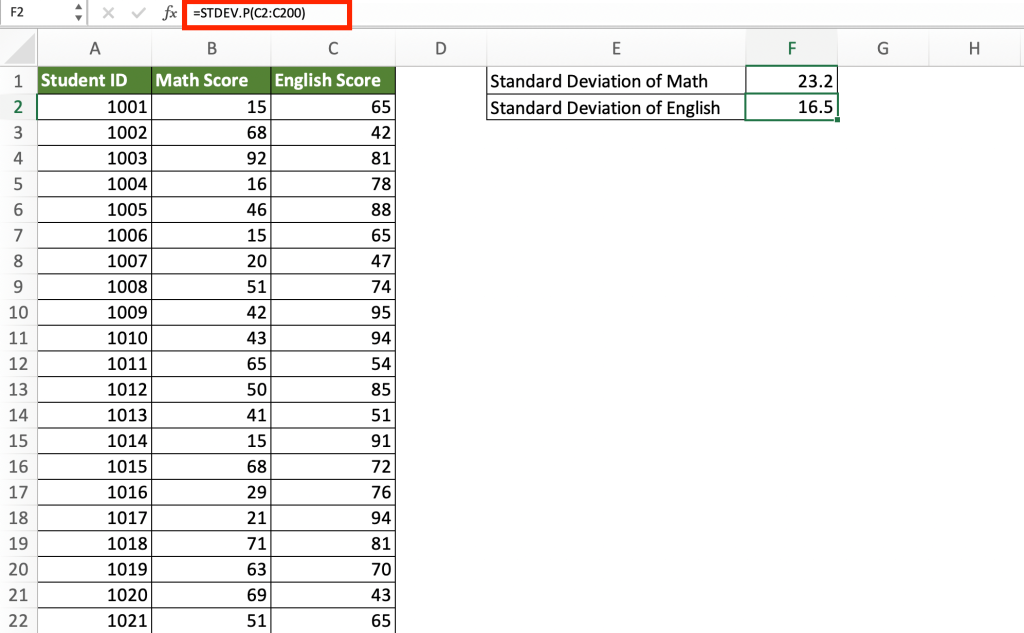
As we can see the two values calculated by Excel for Math and English vary. Let us understand this.
The standard deviation for math is 23.2 marks while for English it is 16.5 marks. This indicates that the spread of marks allotted in English is closer to one another than for math. In other words, there is a lot of variation and deviation from the mean in marks scored in math, i.e., students have scored very low as well as very high marks.
But for English we can see that the standard deviation value is lower, meaning students have scores that are closer to one another.
A simple example –
If hypothetically all students received the same score (say, 60), then the standard deviation would be 0.
A smaller value suggests that the data points are closely spaced and deviate less from each other while a higher value of standard deviation suggests that the data is more widespread. Since all students scored the same the standard deviation in this example is 0.
Applications of Standard Deviation in Excel
- Understanding Data Variability: By calculating the standard deviation, you can determine how much the data points deviate from the mean. A higher standard deviation indicates greater variability, which can be critical in financial analysis, quality control, or market research.
- Identifying Outliers: Outliers are data points that significantly deviate from the rest. Standard deviation helps in identifying outliers by flagging values that lie beyond a specified range from the mean.
- Conditional Formatting: Utilize conditional formatting features to highlight values outside a certain standard deviation range, making it easier to identify outliers or unusual patterns.
- Comparing Data Sets: When comparing multiple data sets, standard deviation enables you to assess their variability and identify which set has a more consistent distribution.
- Error Bars: Adding error bars to charts allows you to visualize the range of values within one standard deviation of the mean.
- Standard Deviation in PivotTables: PivotTables provide a powerful way to summarize and analyze large datasets. You can utilize Excel’s built-in functions to calculate standard deviation within PivotTables.
- Standard Deviation with IF Statements: By combining standard deviation calculations with IF statements, you can perform conditional analyses based on specific criteria.
Conclusion
Standard deviation in Excel allows you to quantify the variability and dispersion of data points, giving you useful insights into the spread and consistency of your data.
Calculating the standard deviation allows you to make informed judgments, discover outliers, compare data sets, and efficiently visualize data. The functions and visualization capabilities of Excel make it simple to compute and analyze standard deviation, allowing you to gain deeper insights and make data-driven decisions.
Excel permits you to harness the power of standard deviation for a wide range of applications in numerous industries, from finance to science to social sciences, whether you’re dealing with a sample or a population. So, dive into Excel, explore its standard deviation capabilities, and enhance your data analysis skills to extract meaningful information from your data sets.
Further Learning:
- A Comprehensive Guide to Descriptive Statistics in Excel
- 6 Simple Steps for Conducting Regression in Excel
- Master ANOVA in Excel: A Step-by-Step Tutorial

John Michaloudis is a former accountant and finance analyst at General Electric, a Microsoft MVP since 2020, an Amazon #1 bestselling author of 4 Microsoft Excel books and teacher of Microsoft Excel & Office over at his flagship MyExcelOnline Academy Online Course.


