Free Practice Workbook
Microsoft Copilot allows you to perform tasks in a spreadsheet much faster and more easily. Instead of manually writing formulas, creating charts, analyzing data, or cleaning a worksheet, you can describe what you want in plain English. The quality of the result depends on how clearly you write your prompt.
In this article, you will find 50 Best Copilot prompts for Excel.
Key Takeaways:
- Copilot lets you perform Excel tasks using simple, natural language prompts.
- You can use Copilot to create formulas, charts, summaries, and reports.
- Copilot can help spot trends, duplicates, missing values, and data inconsistencies.
- Make sure that the prompts are clear and specific.
- Always review the results provided by Copilot before using them.
Table of Contents
50 Best Copilot Prompts for Excel
Formula Prompts
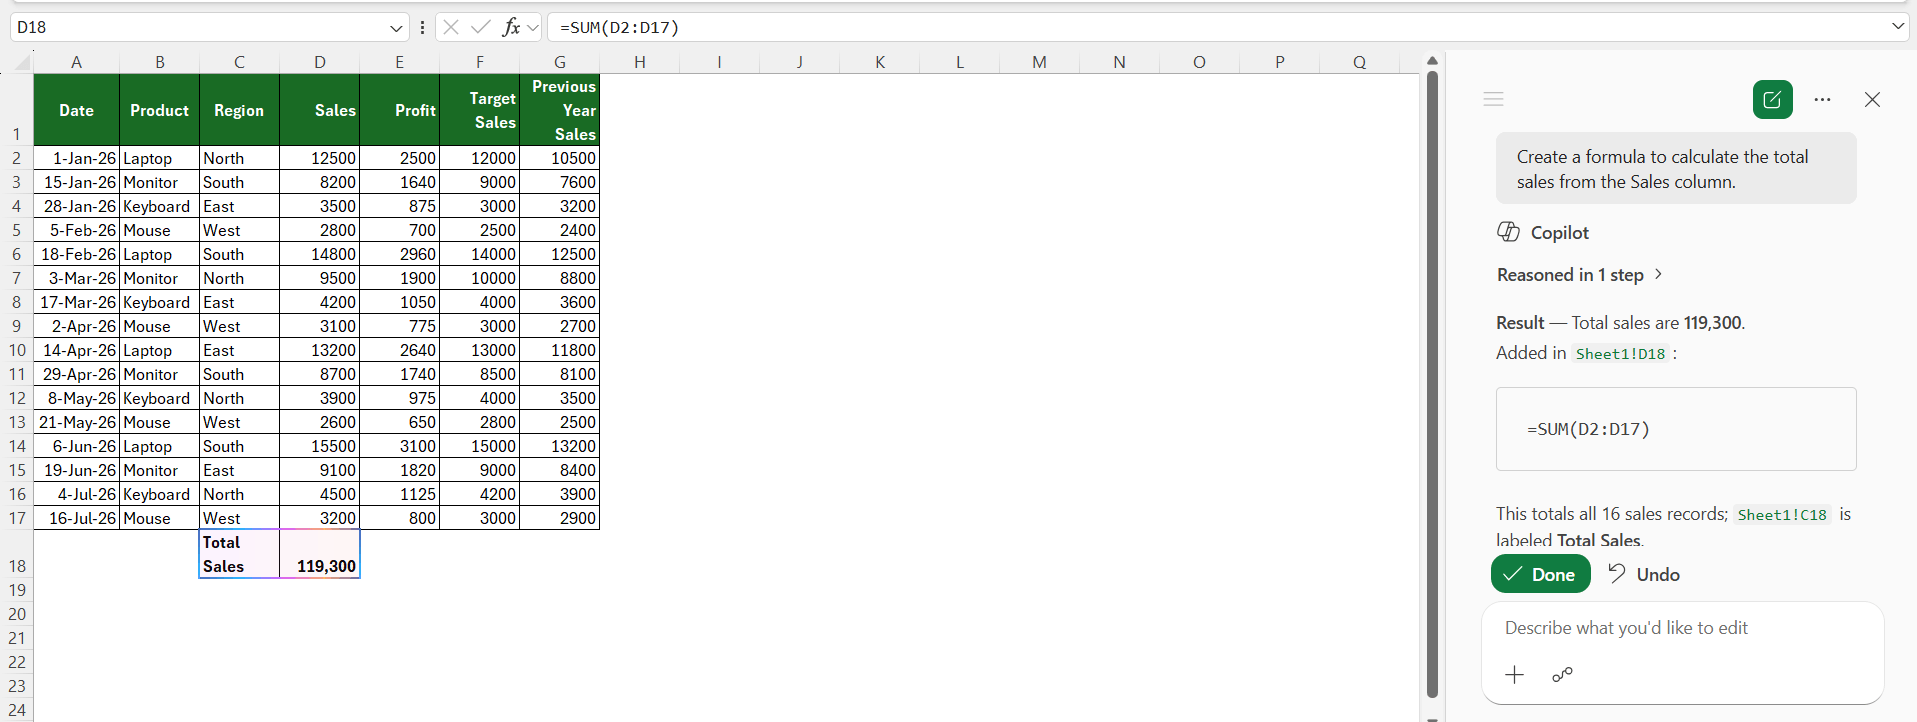
1. Create a SUM formula
Create a formula to calculate the total sales from the Sales column.
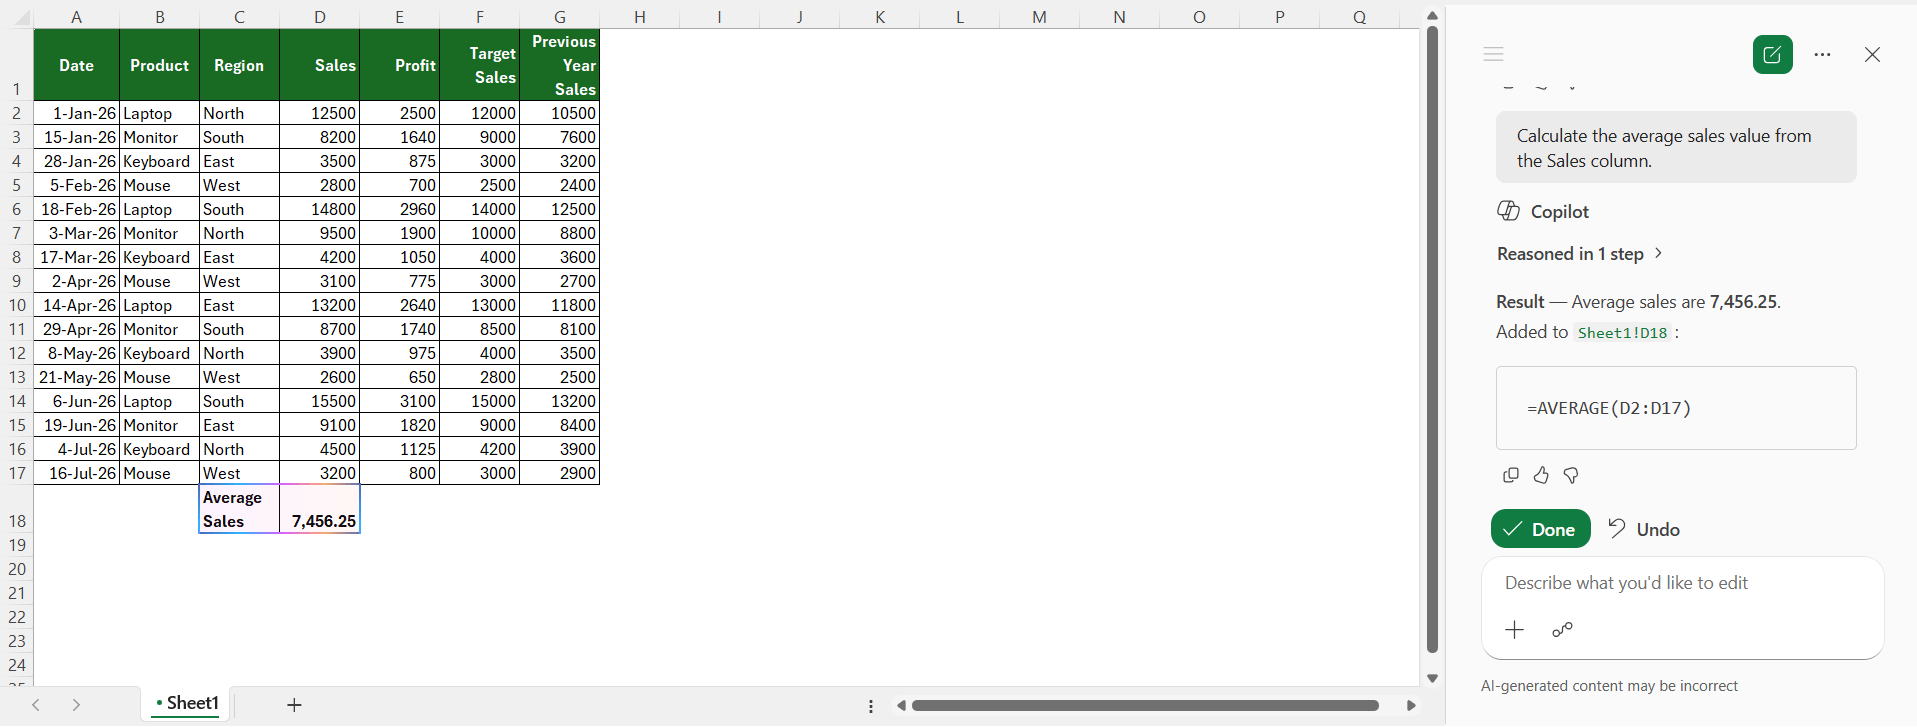
2. Calculate an average
Calculate the average sales value from the Sales column.
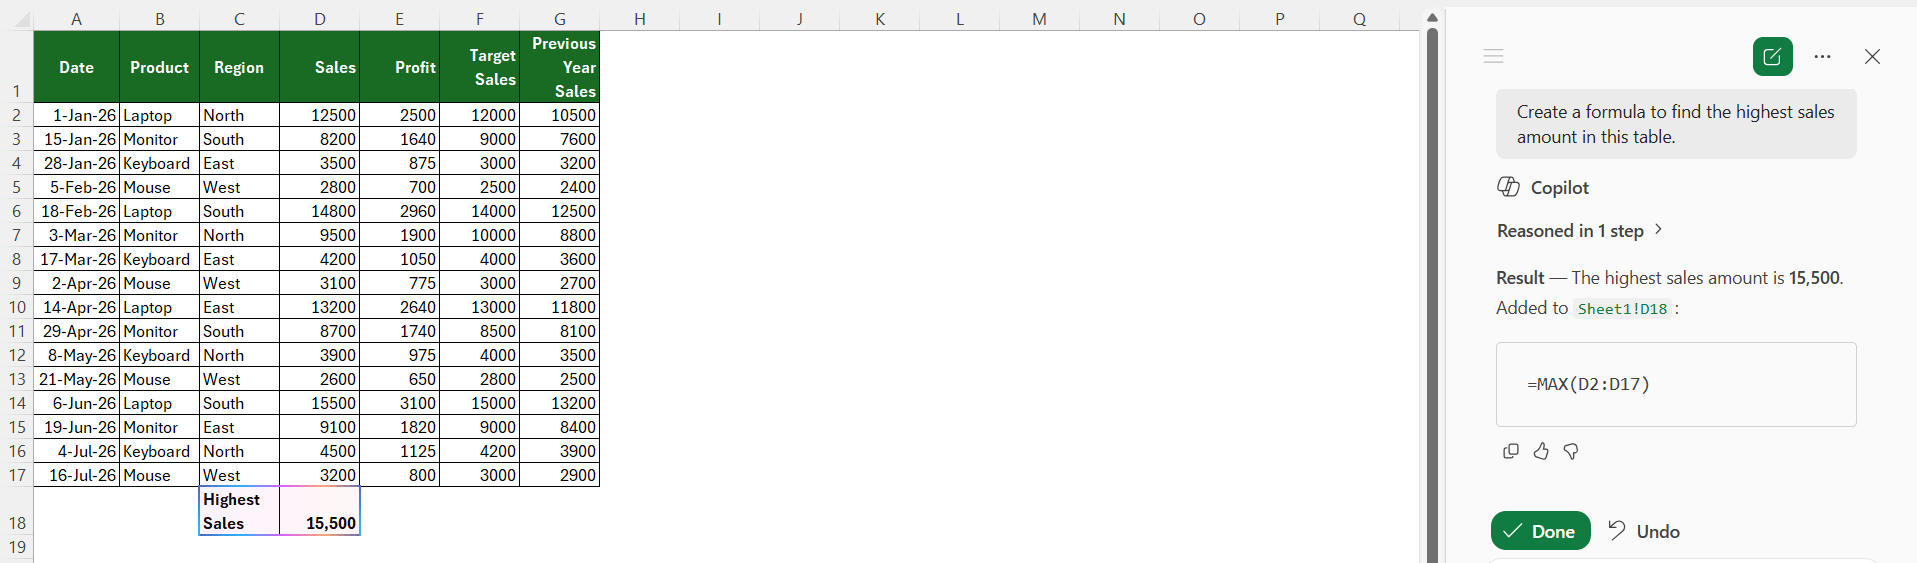
3. Find the highest value
Create a formula to find the highest sales amount in this table.
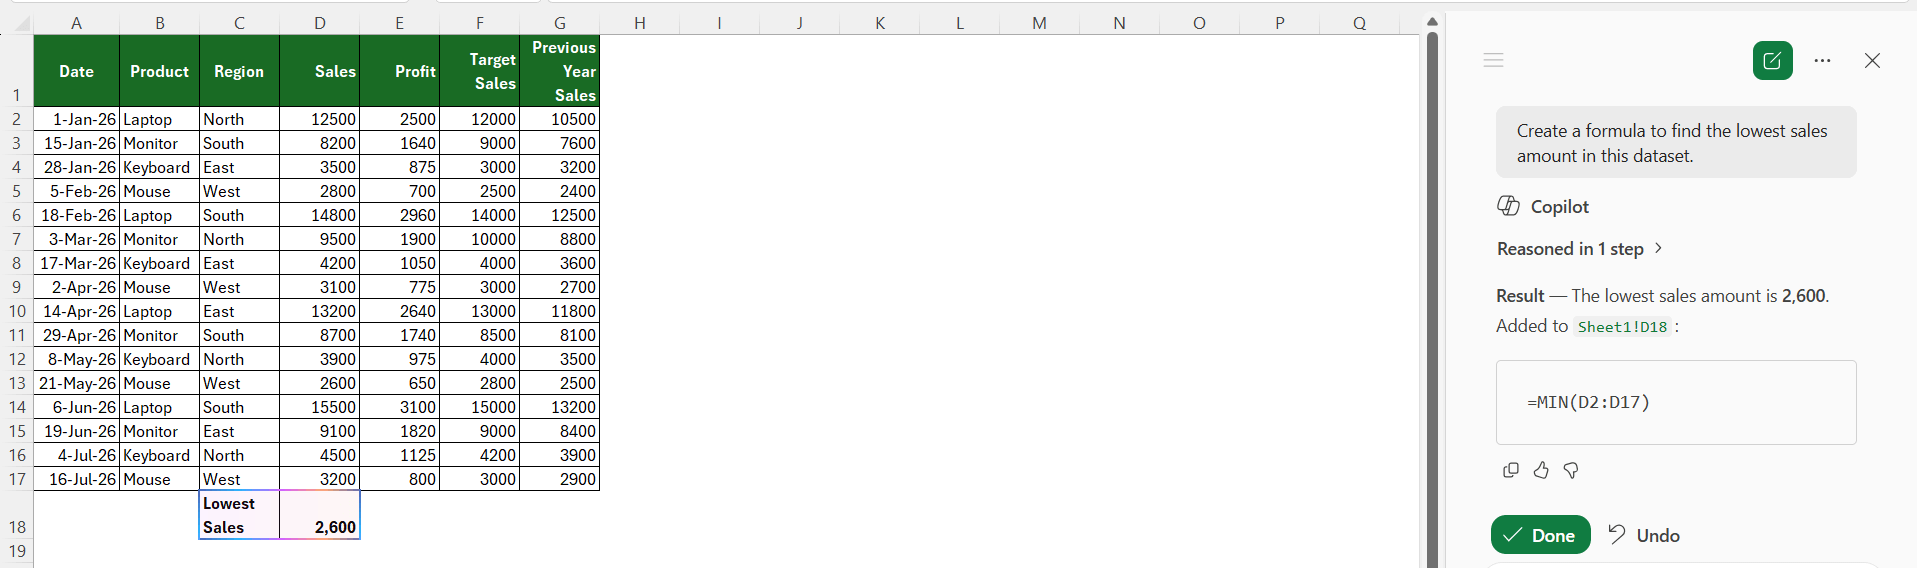
4. Find the lowest value
Create a formula to find the lowest sales amount in this dataset.
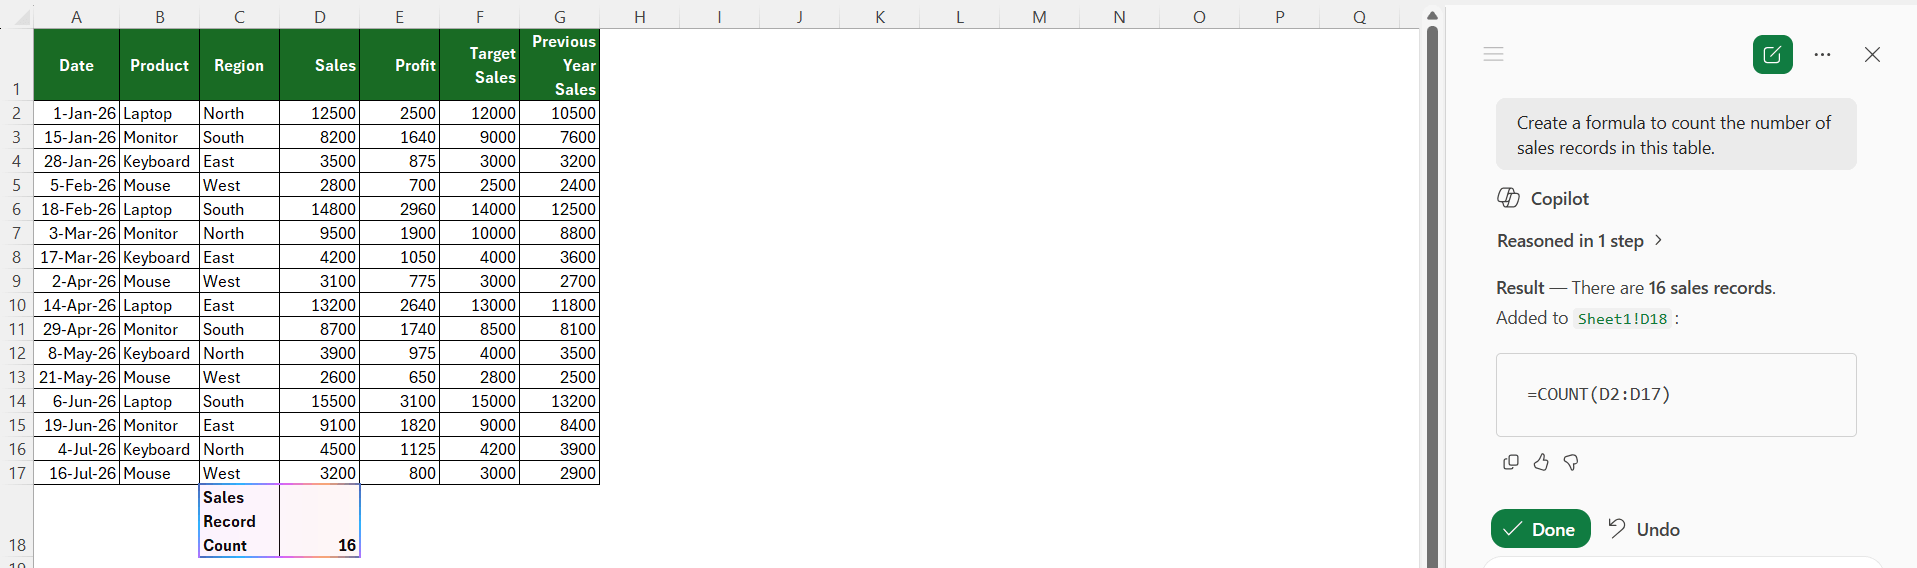
5. Count records
Create a formula to count the number of sales records in this table.
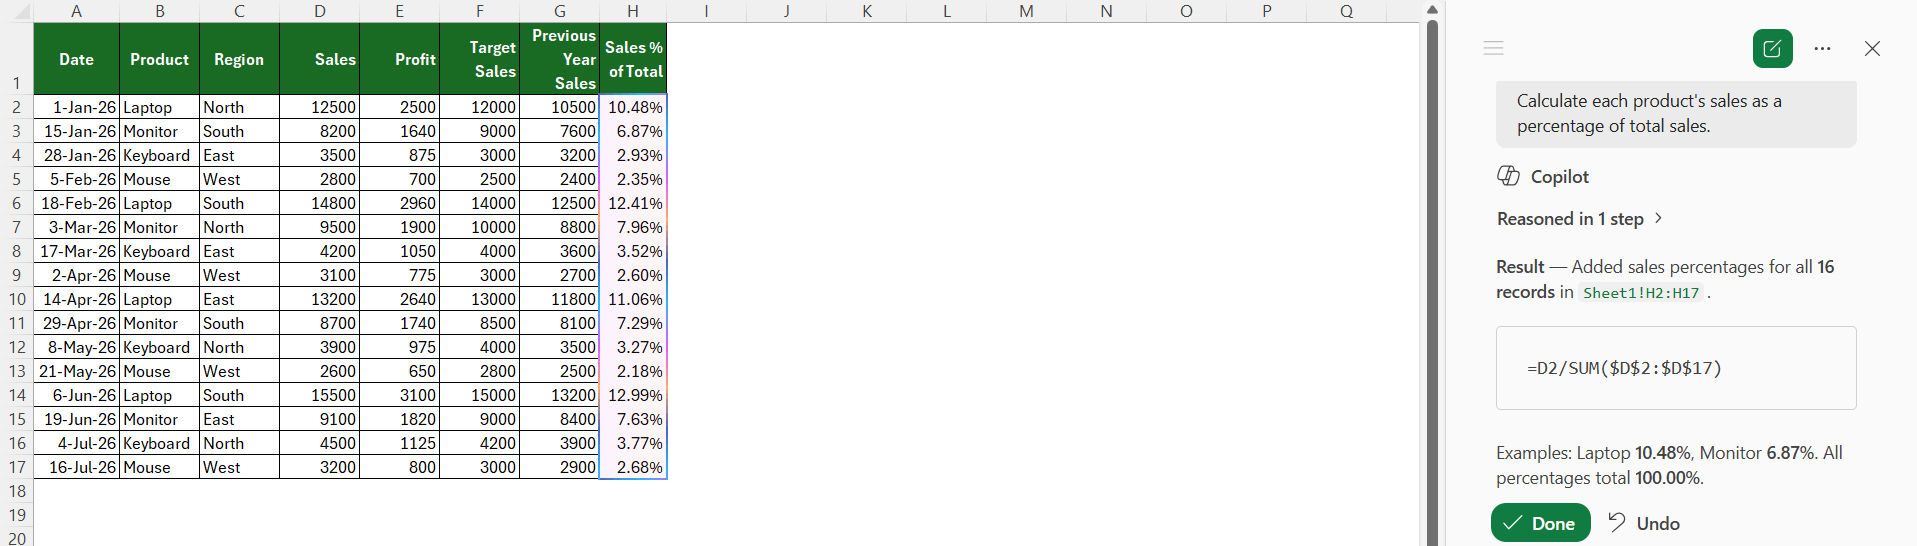
6. Calculate percentage
Calculate each product’s sales as a percentage of total sales.
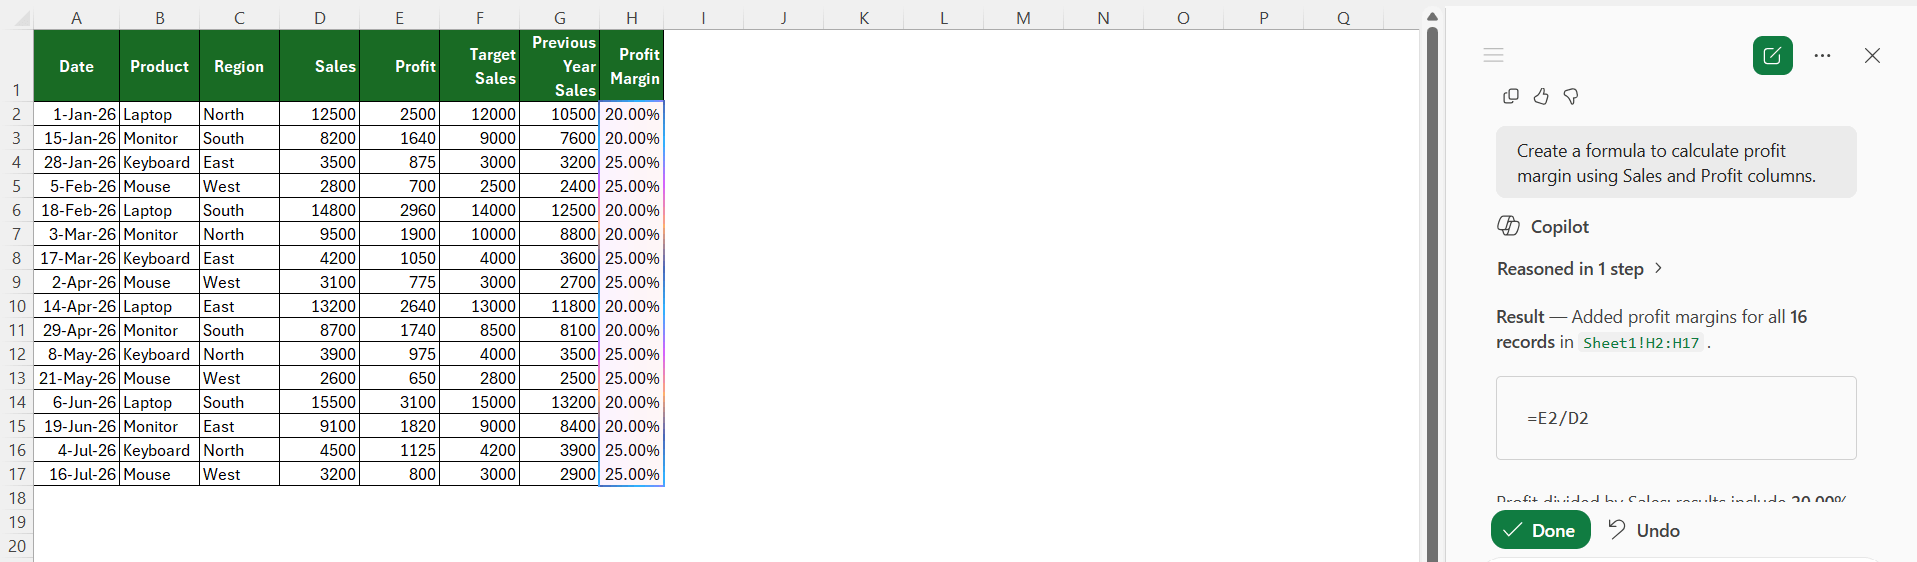
7. Calculate profit margin
Create a formula to calculate profit margin using Sales and Profit columns.
8. Compare two columns
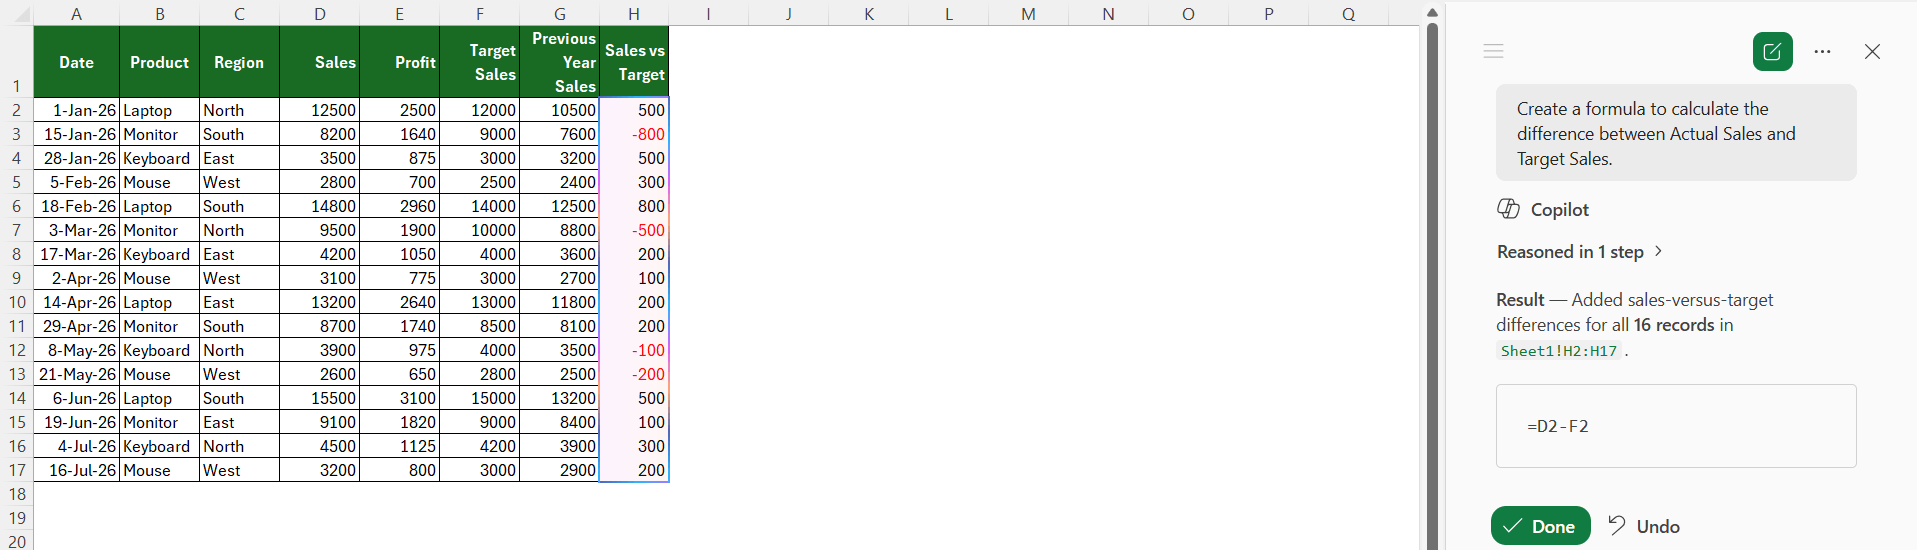
Create a formula to calculate the difference between Actual Sales and Target Sales.
9. Calculate year-over-year growth
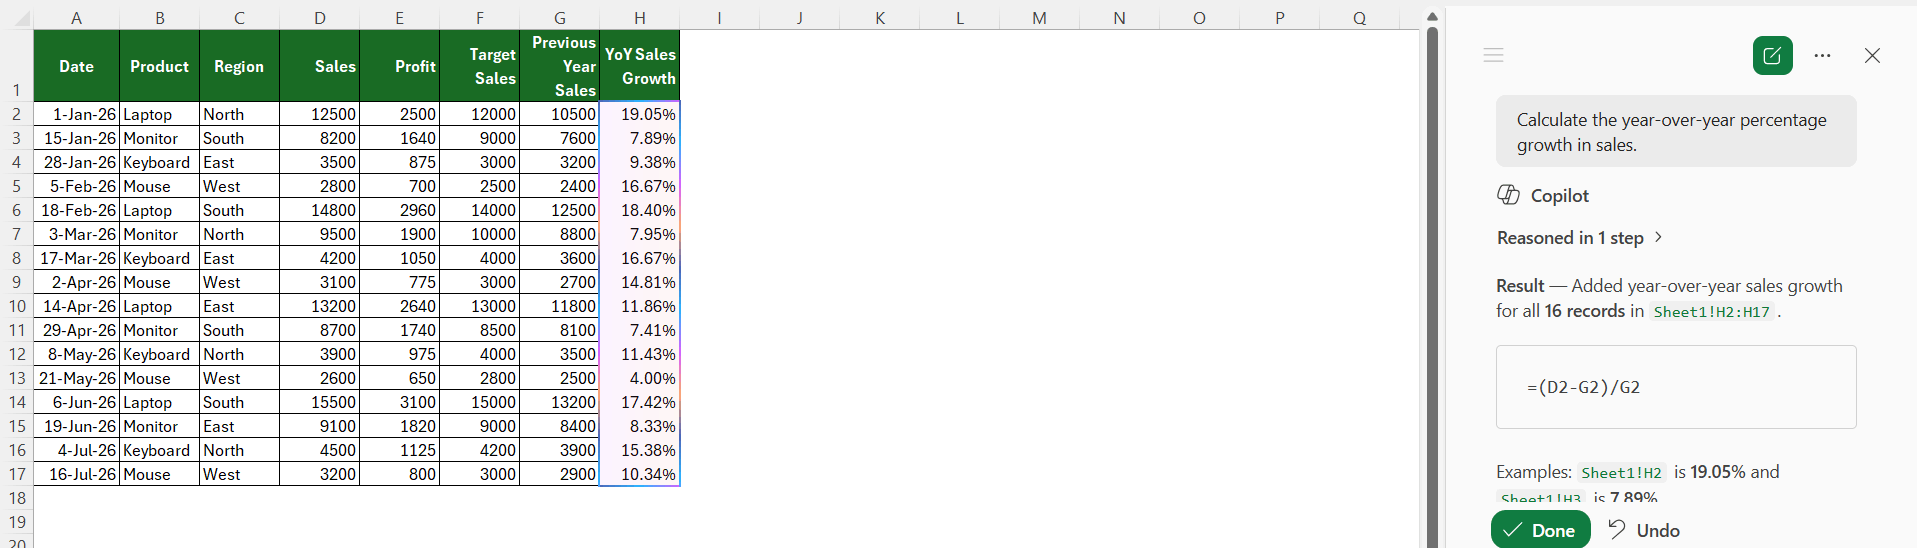
Calculate the year-over-year percentage growth in sales.
10. Create an IF formula
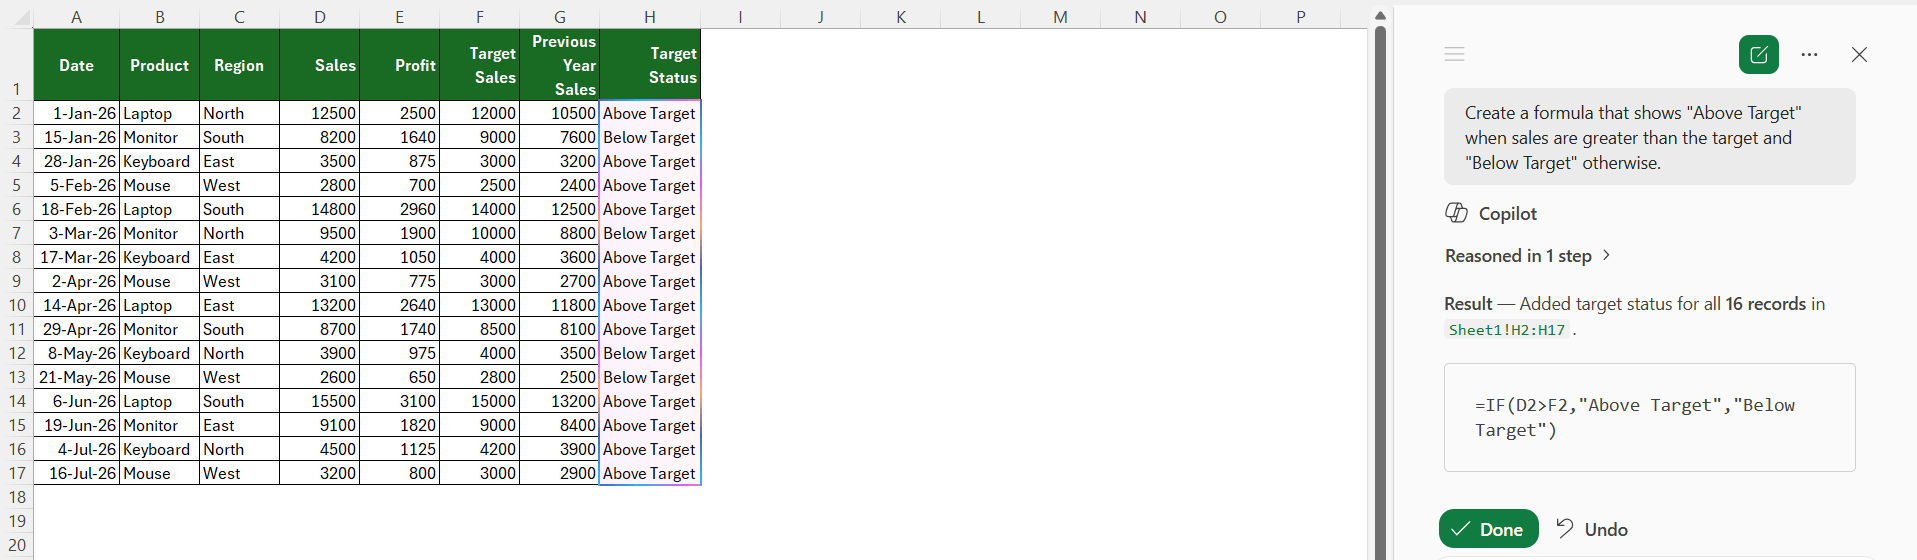
Create a formula that shows “Above Target” when sales are greater than the target and “Below Target” otherwise.
Data Analysis Prompts
11. Find top-performing products
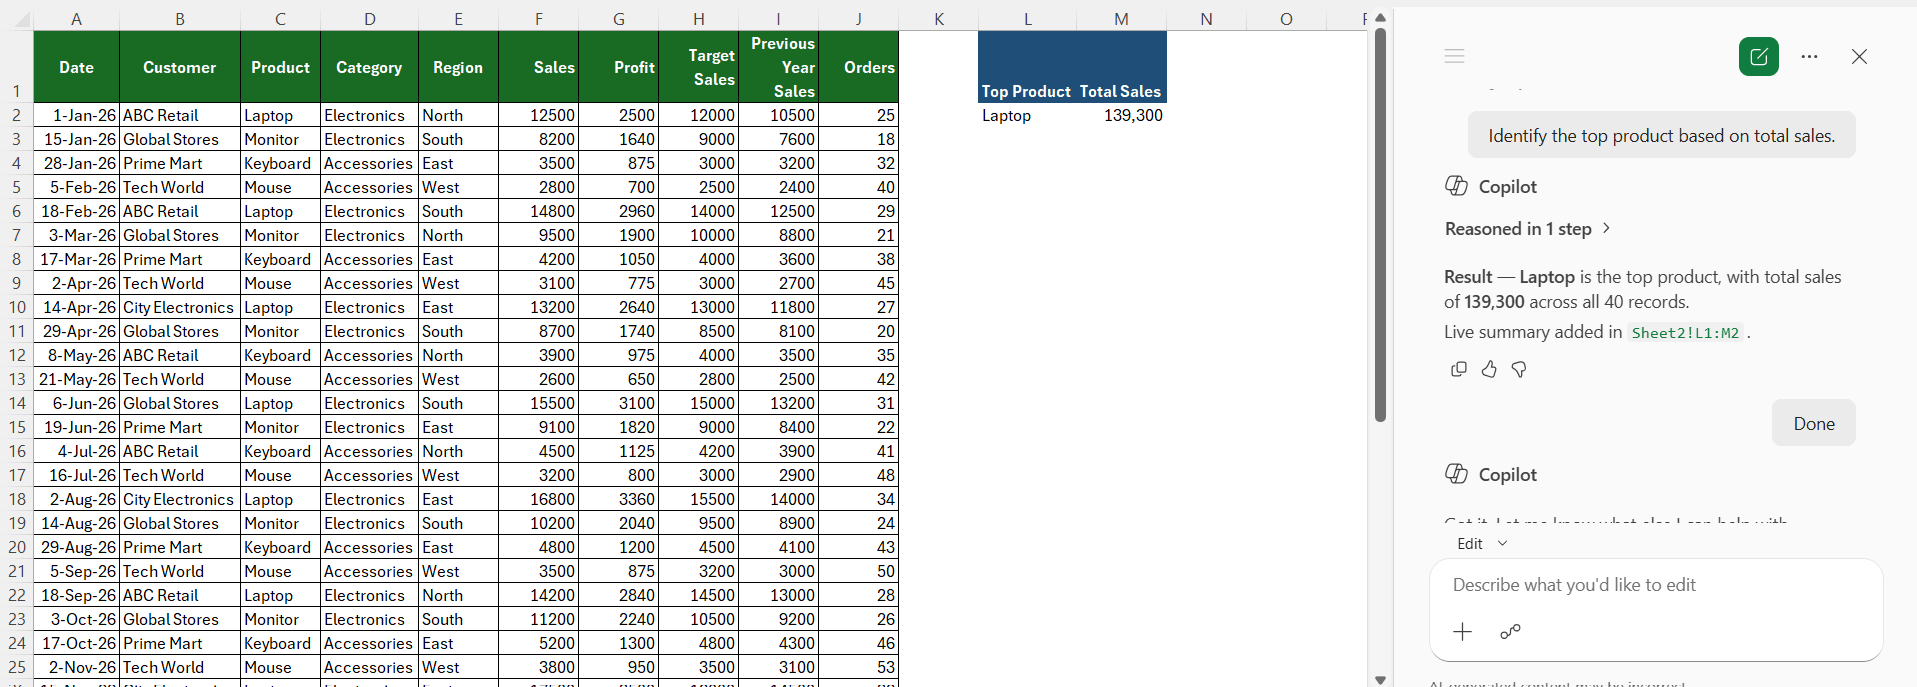
Identify the top product based on total sales.
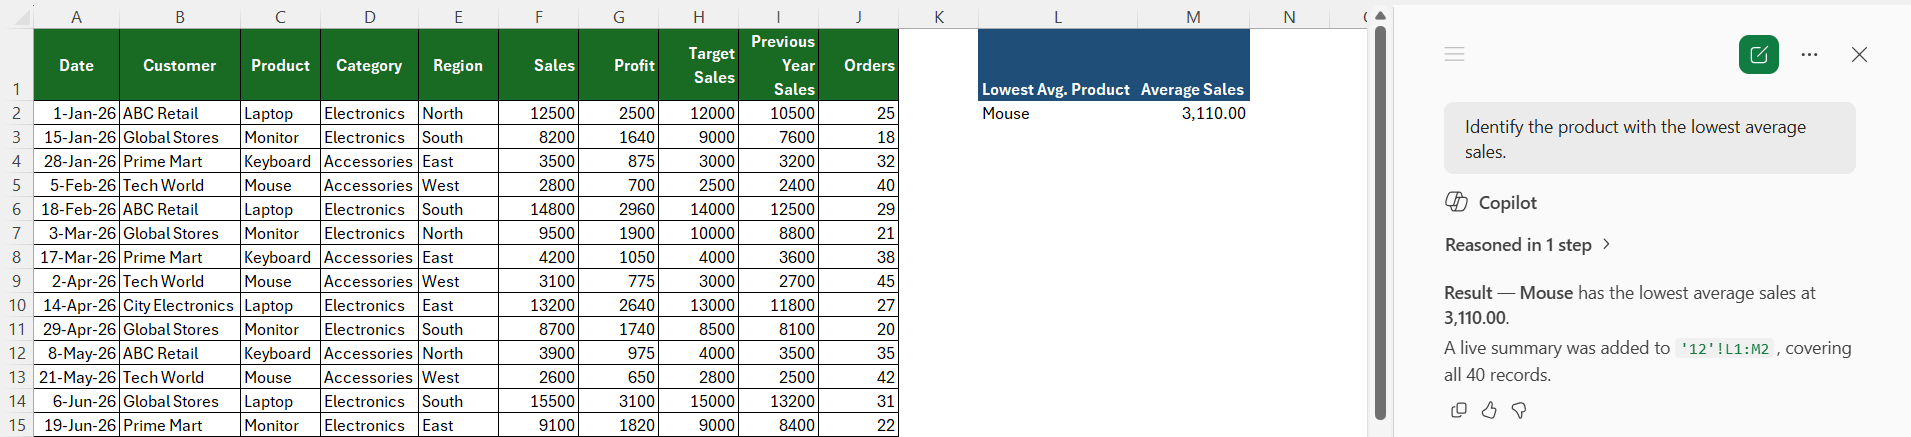
12. Find the lowest-performing products
Identify the product with the lowest average sales.
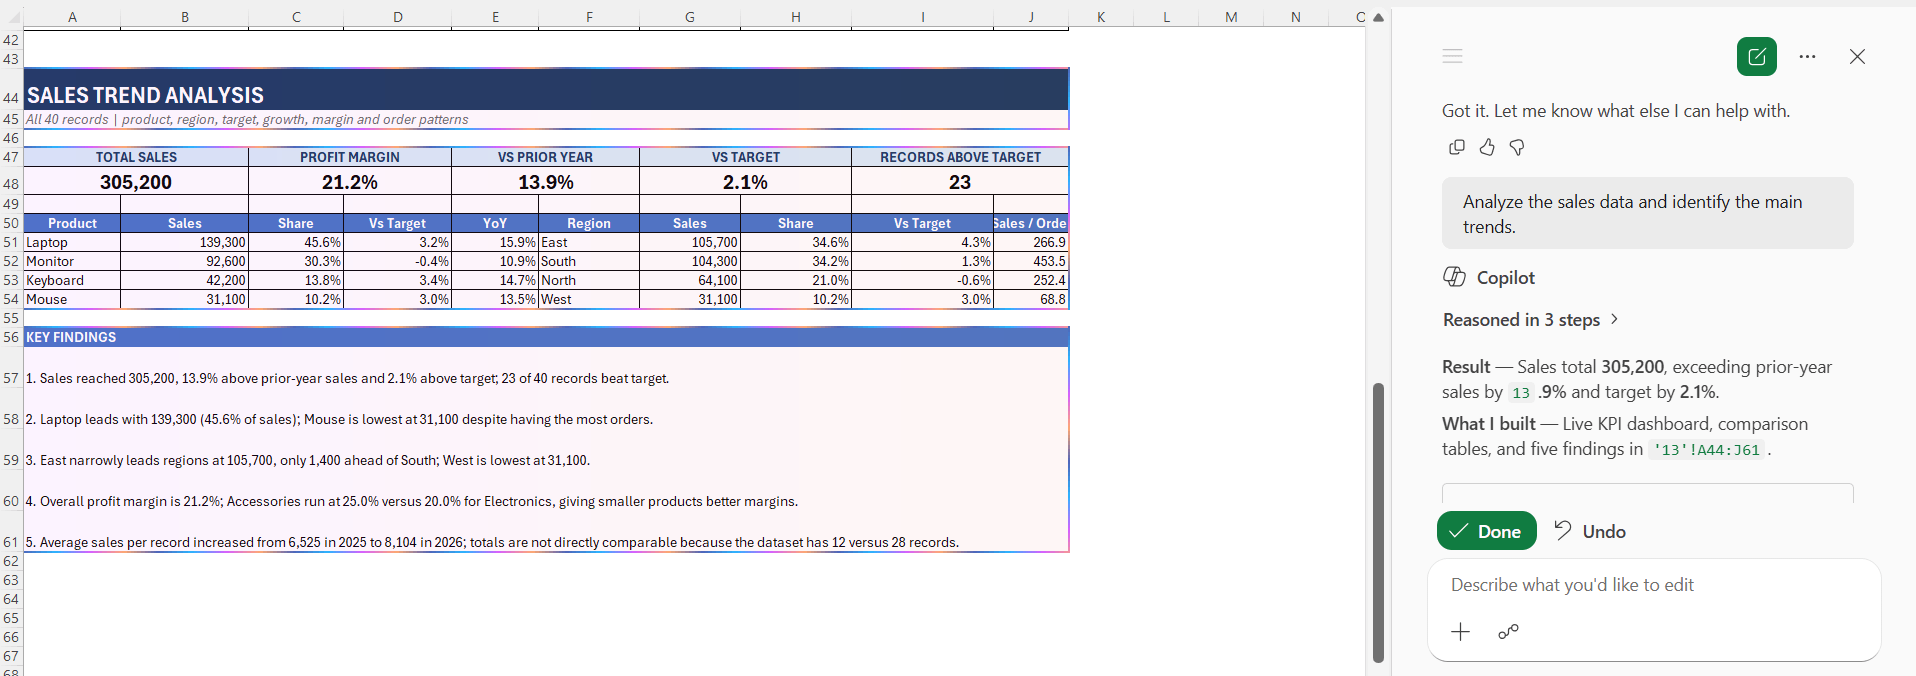
13. Identify sales trends
Analyze the sales data and identify the main trends.
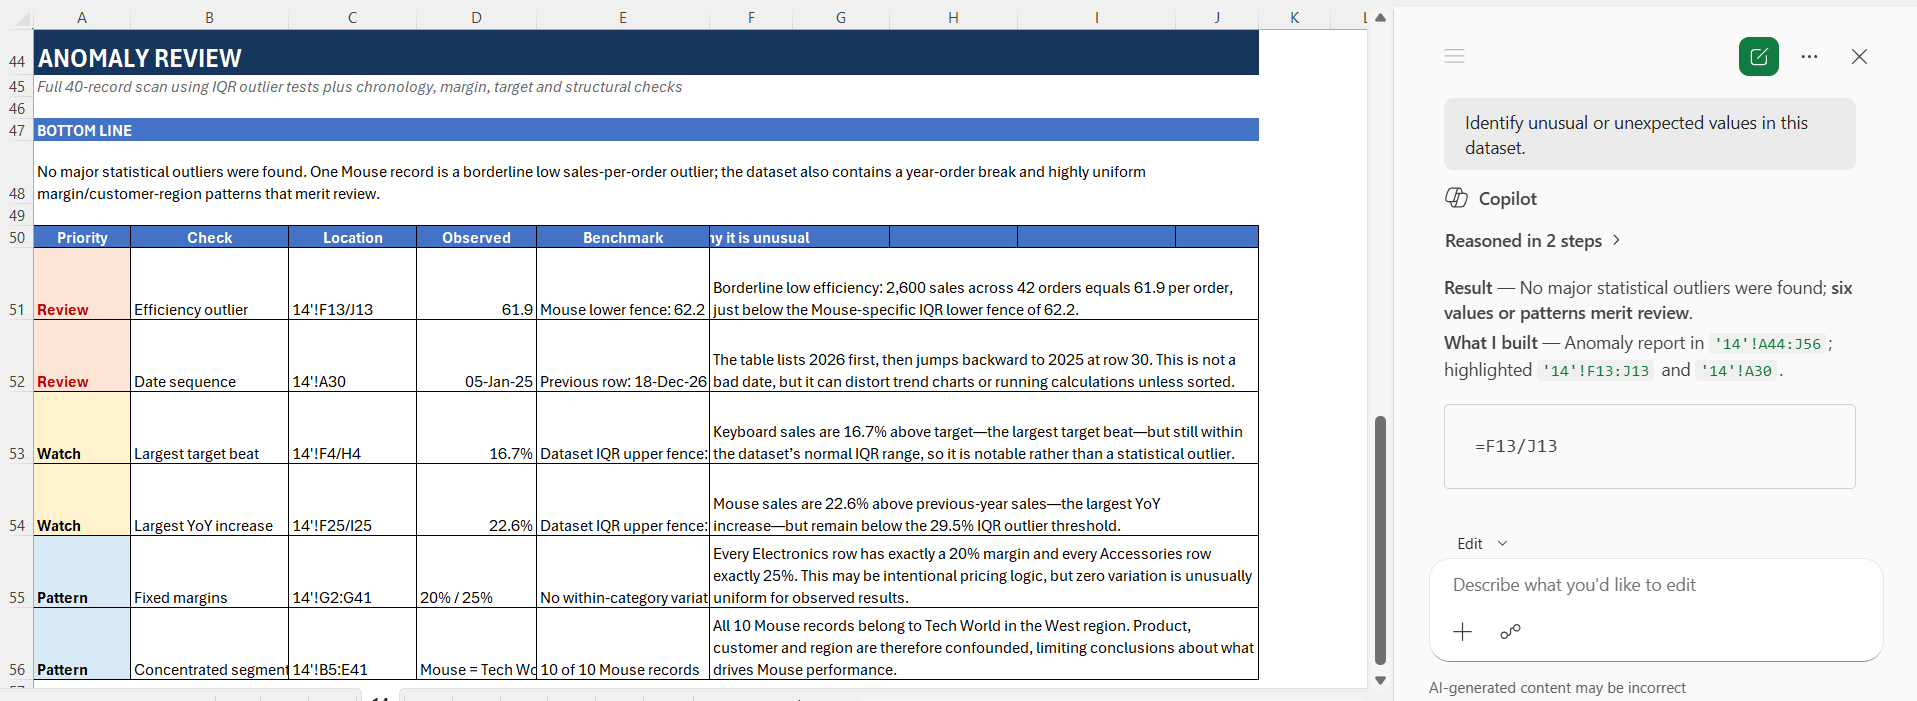
14. Find unusual values
Identify unusual or unexpected values in this dataset.
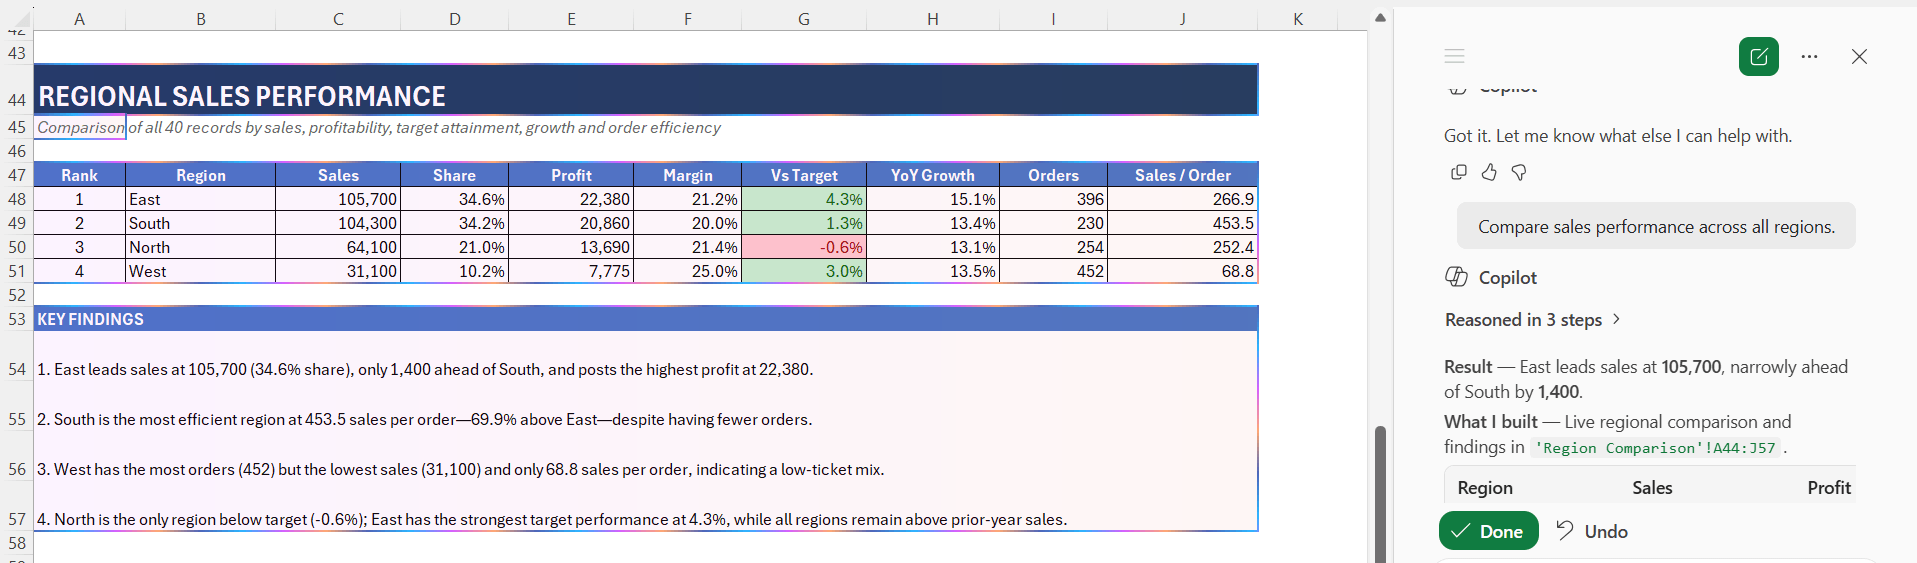
15. Analyze regional performance
Compare sales performance across all regions.
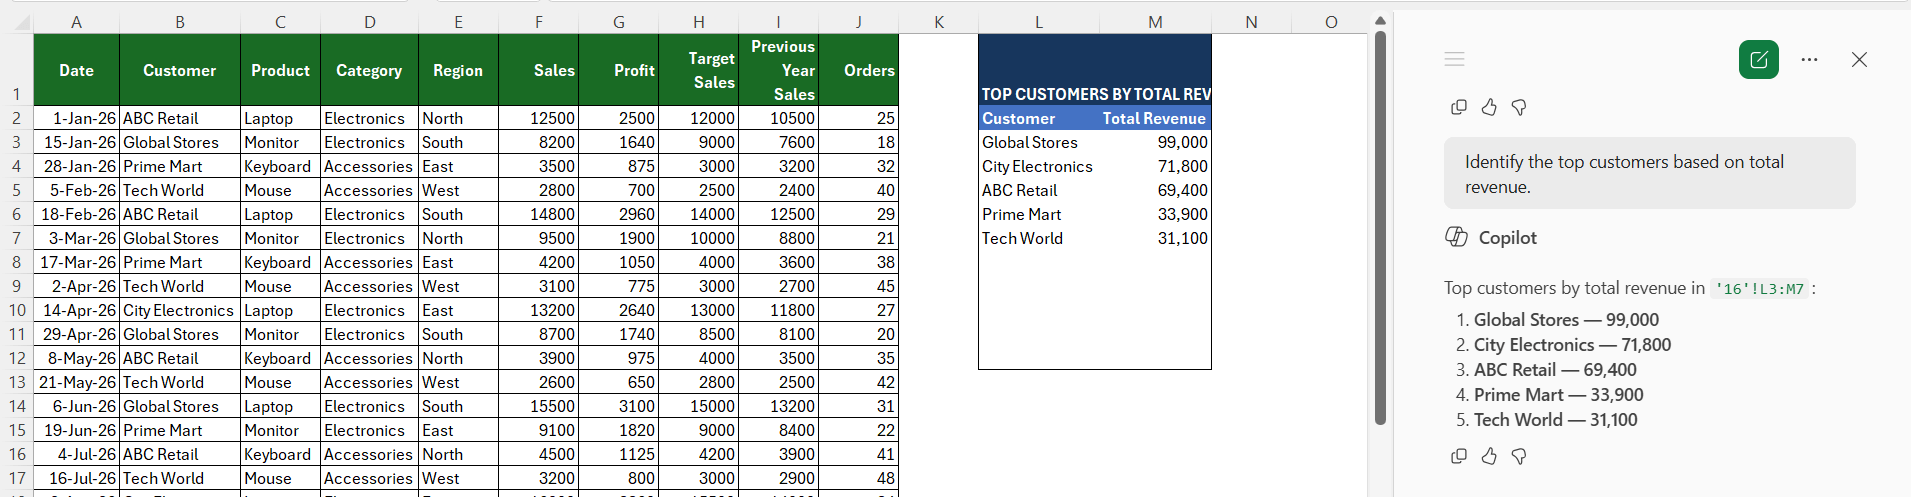
16. Find the largest customers
Identify the top customers based on total revenue.
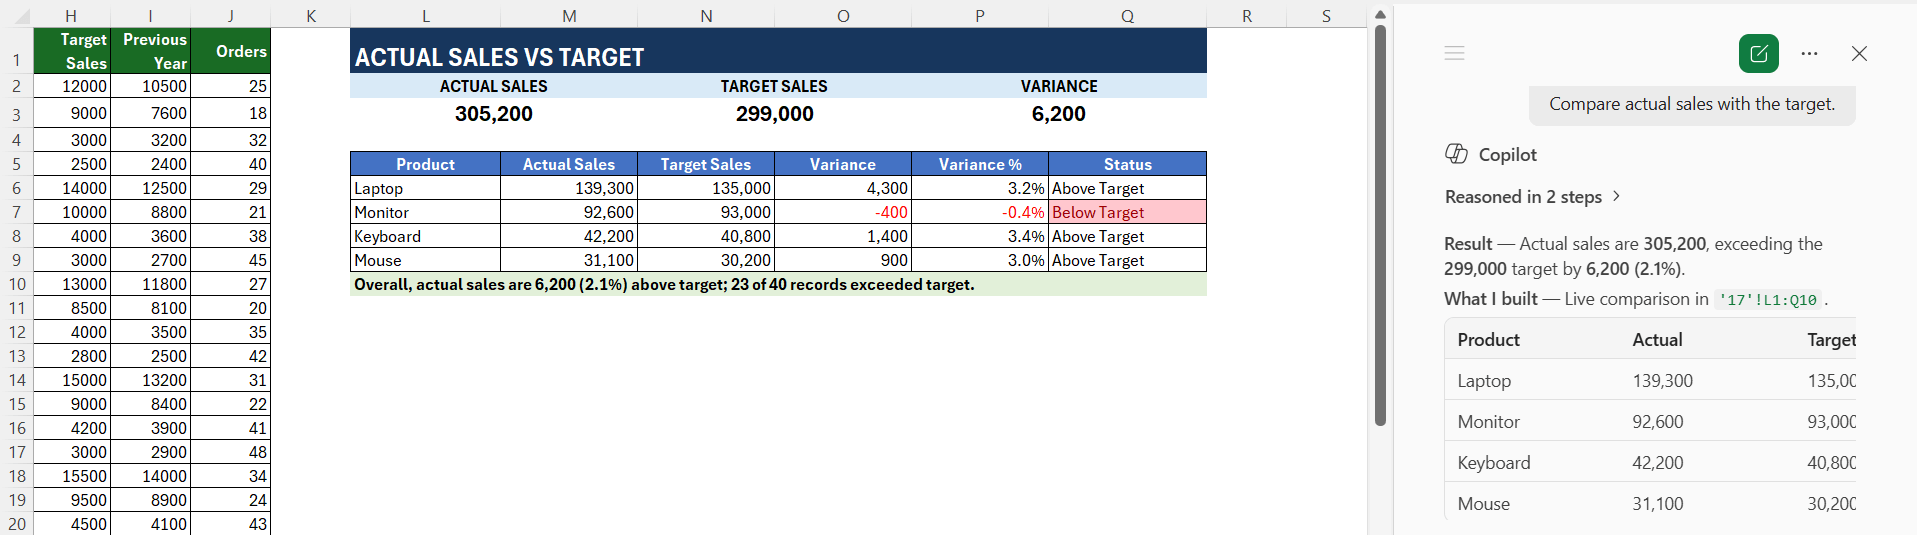
17. Compare actual vs target
Compare actual sales with the target.
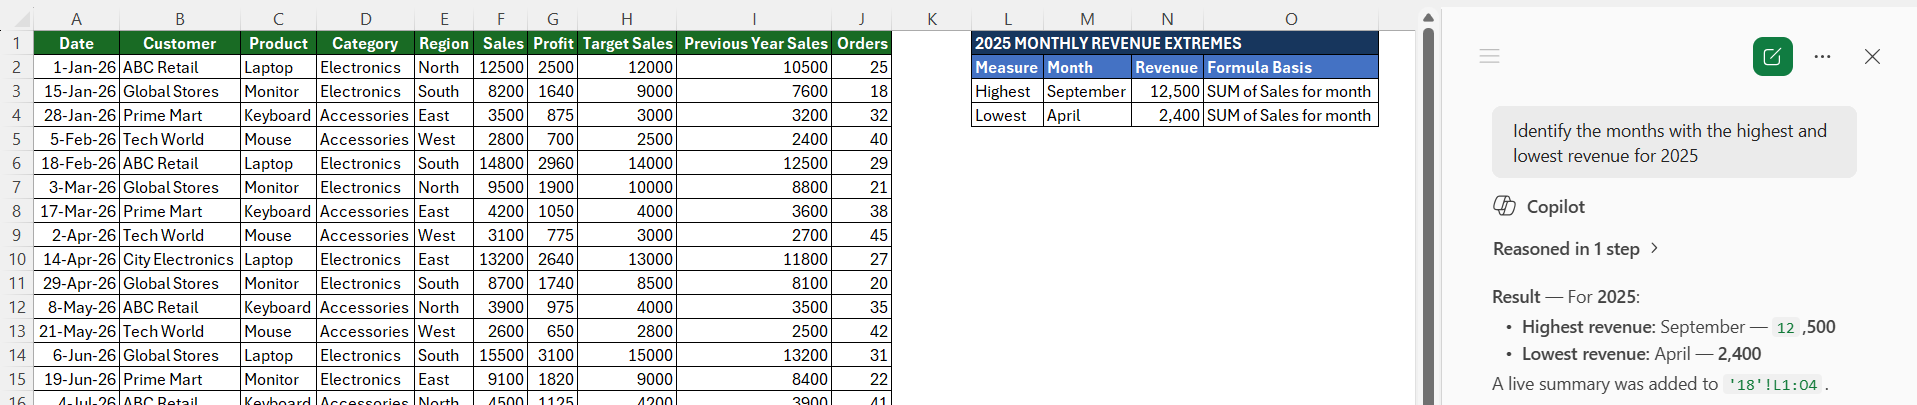
18. Analyze monthly sales
Identify the months with the highest and lowest revenue for 2025.
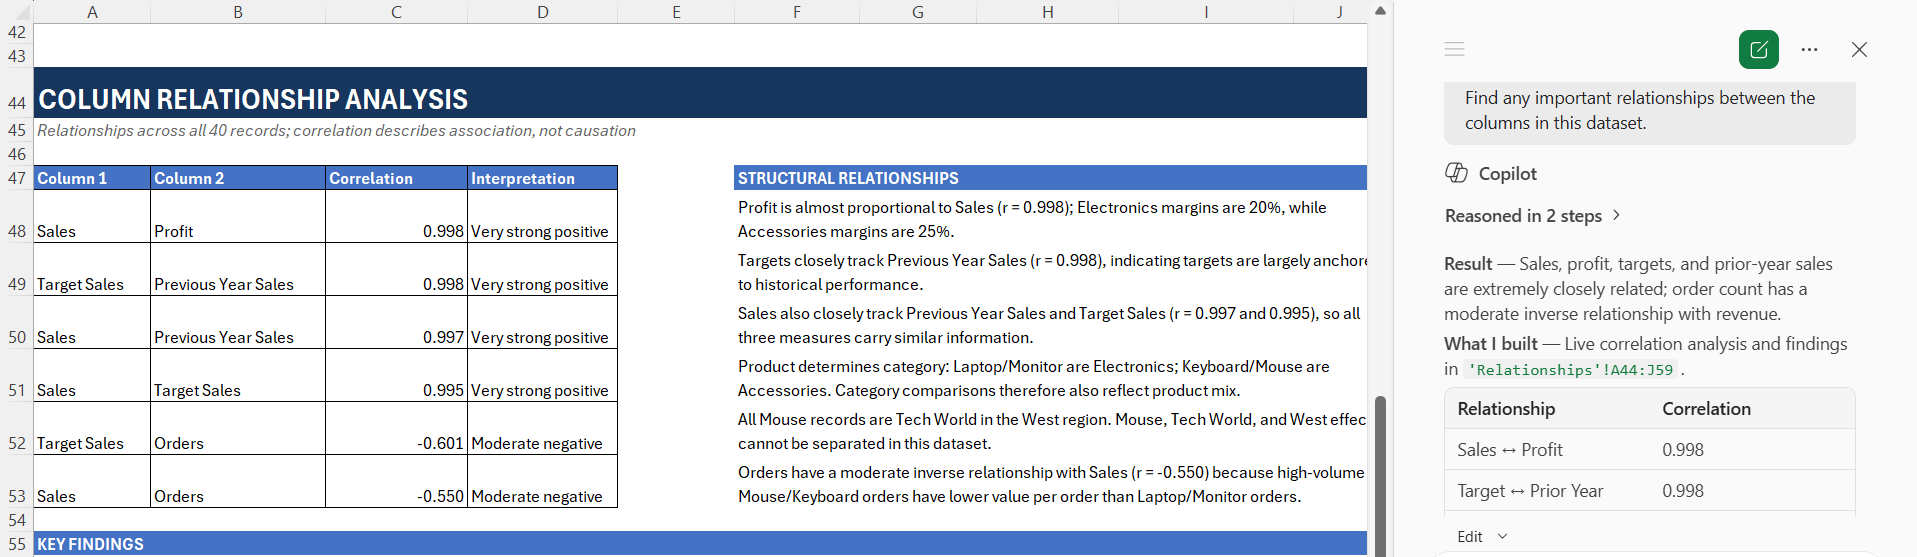
19. Find relationships
Find any important relationships between the columns in this dataset.
20. Summarize the dataset
Give me a quick summary of the key findings from this dataset.
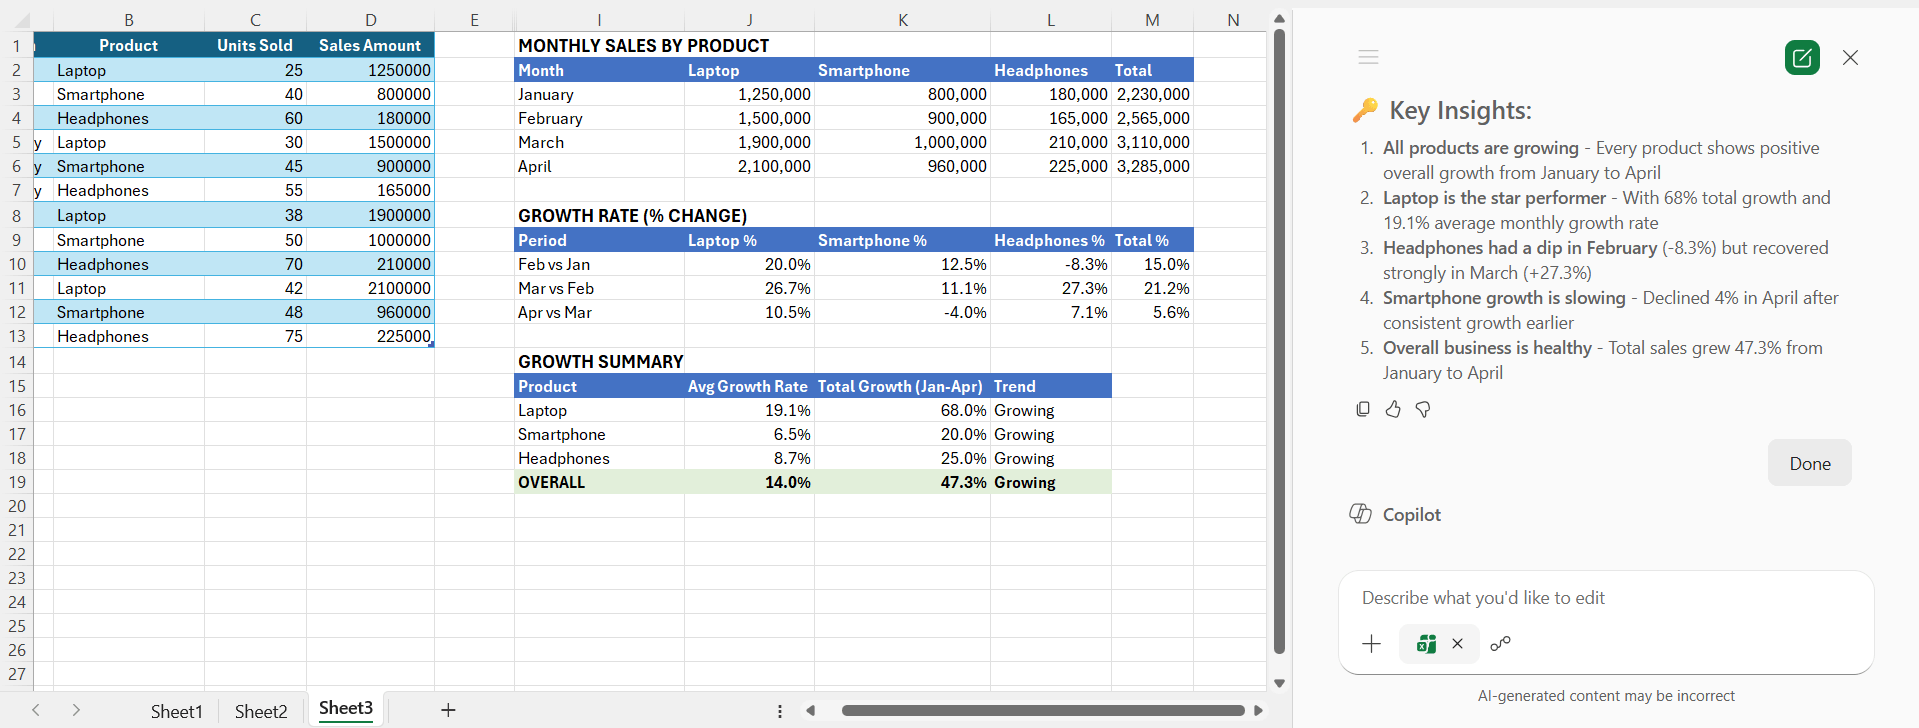
Chart Prompts
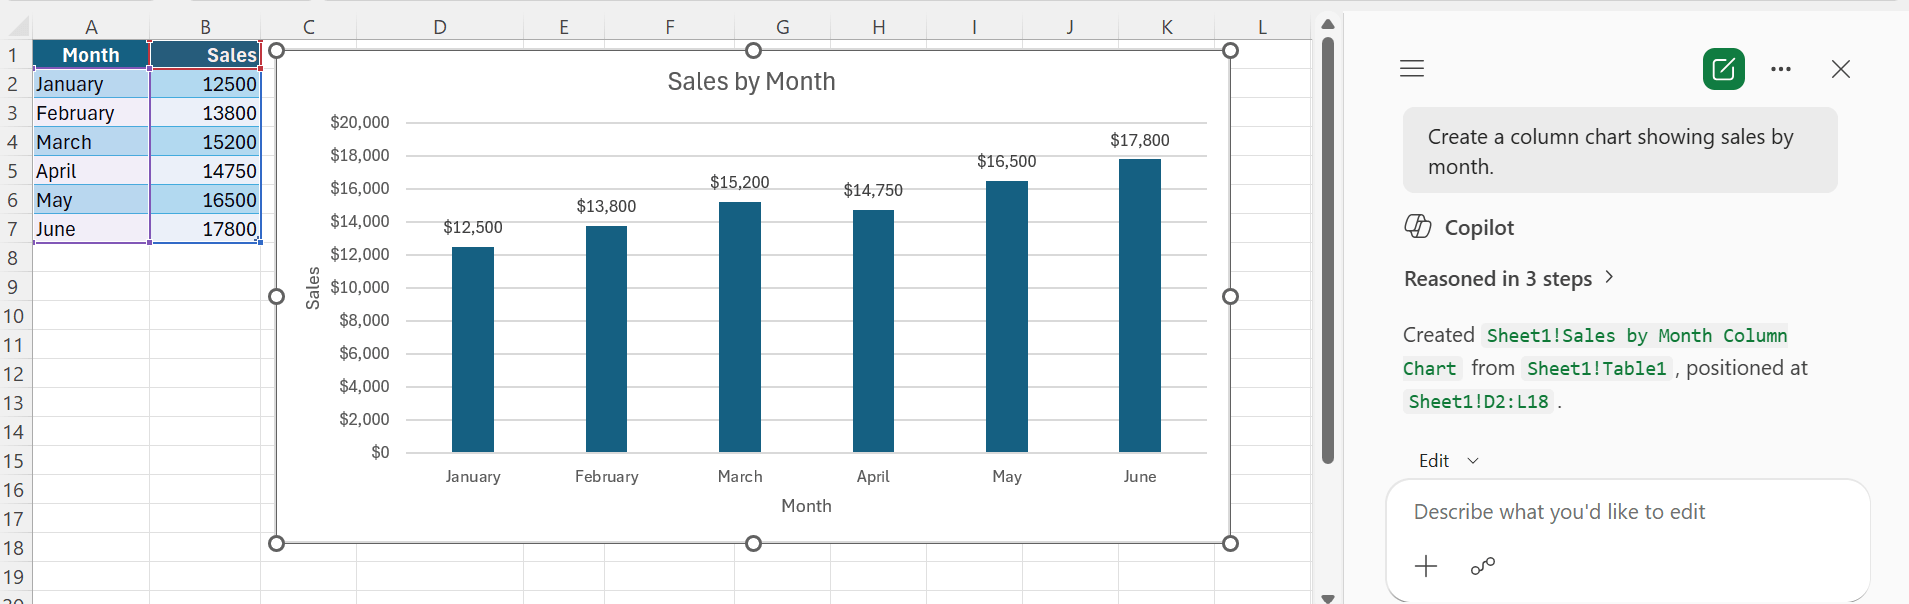
21. Create a sales chart
Create a chart that shows the total sales by month.
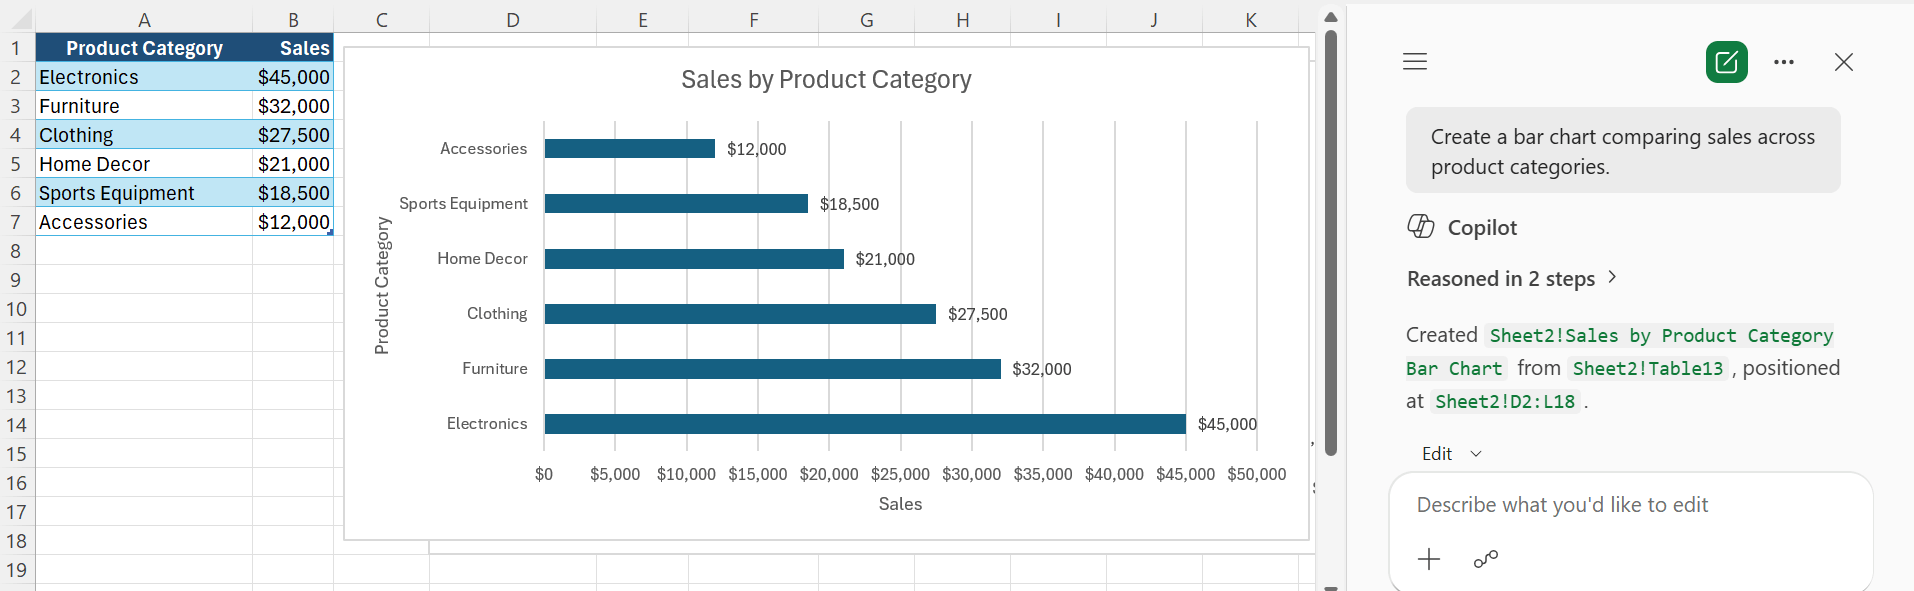
22. Create a regional chart
Create a bar chart that compares sales across regions.
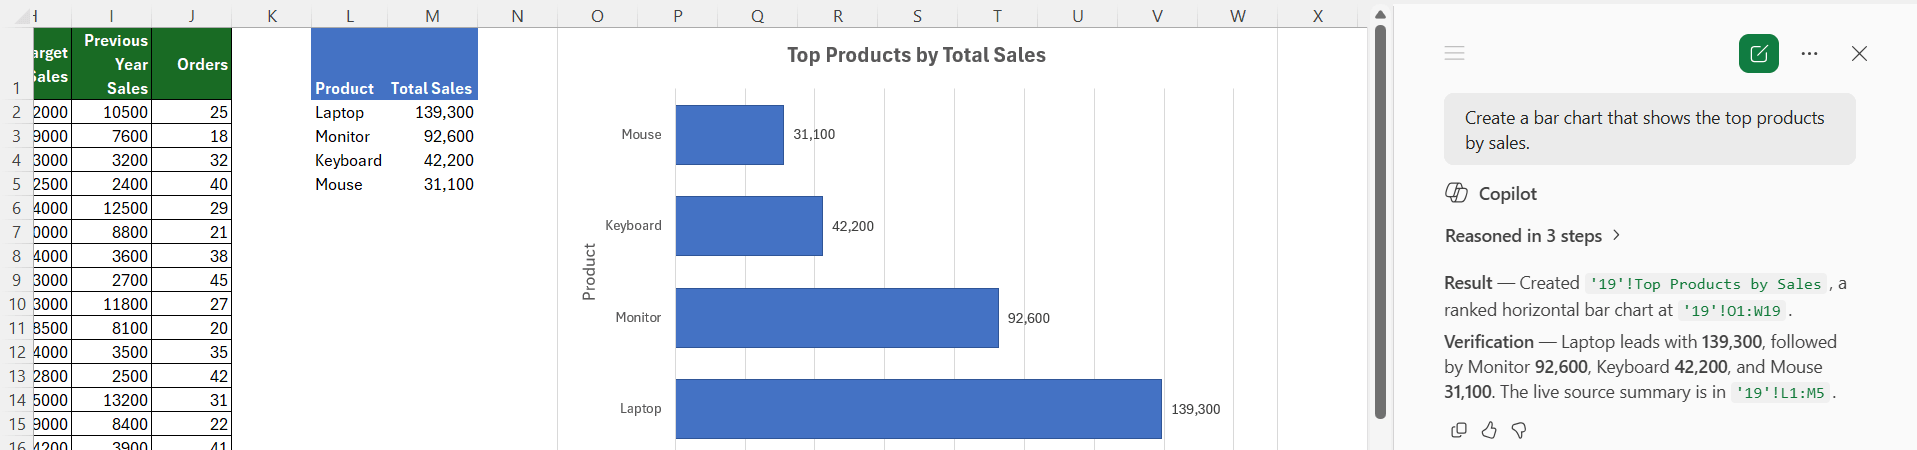
23. Create a product chart
Create a bar chart that shows the top products by sales.
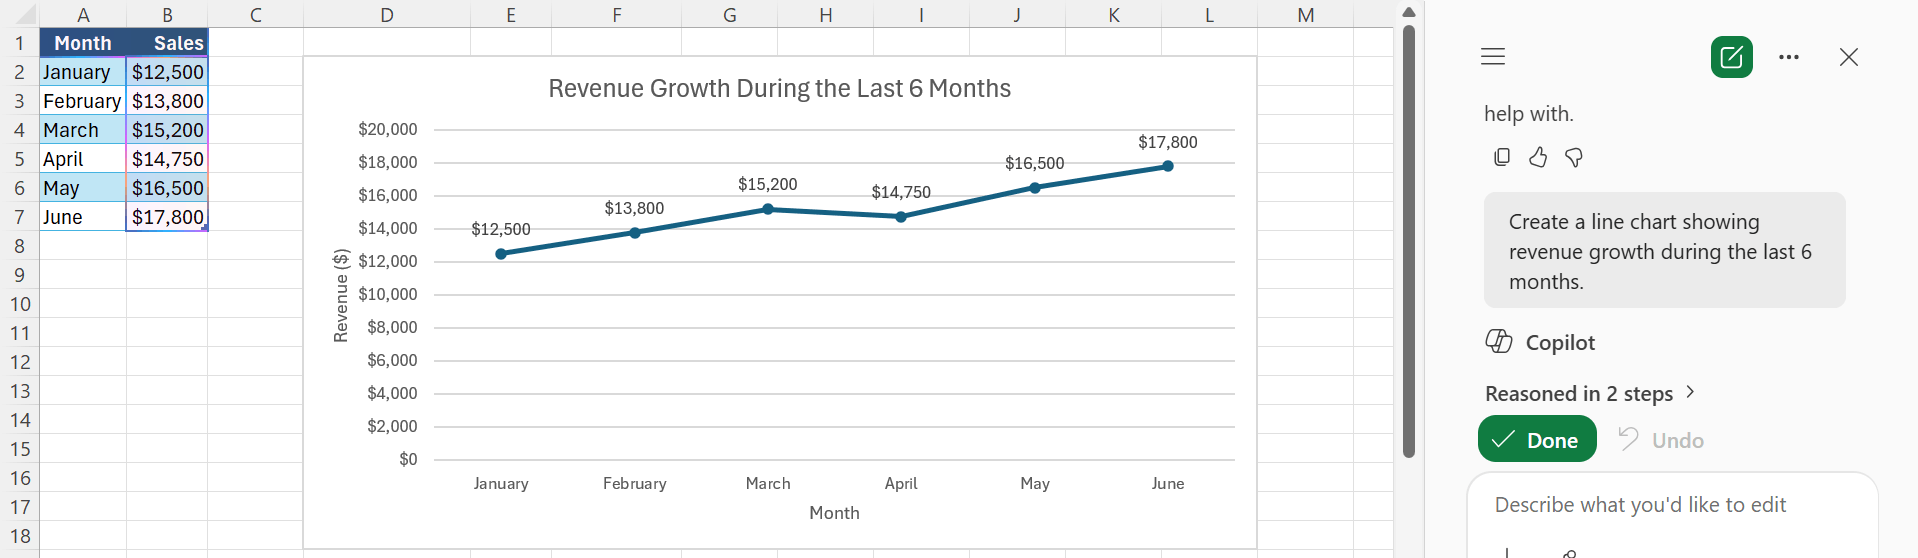
24. Show a trend
Create a line chart that shows the monthly sales trend.
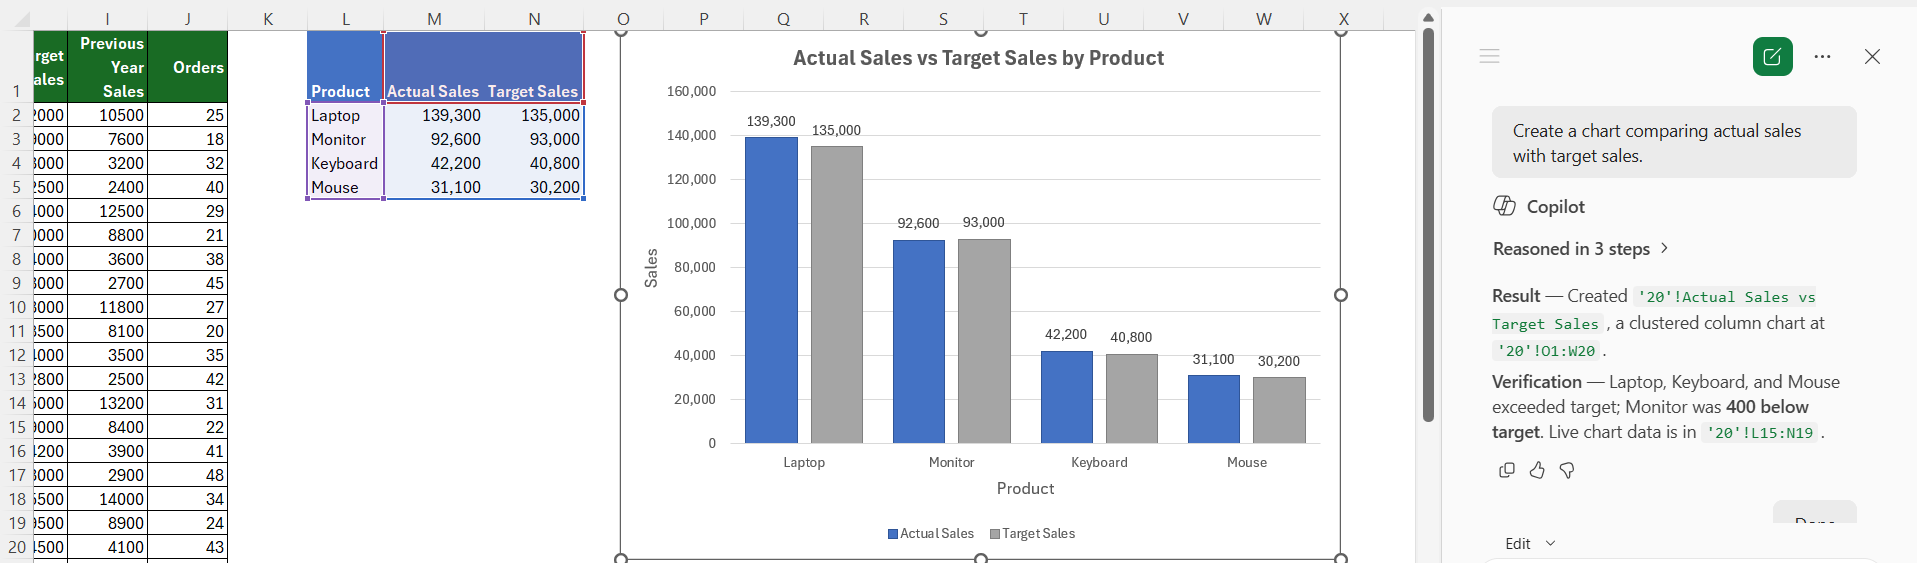
25. Compare actual and target
Create a chart comparing actual sales with target sales.
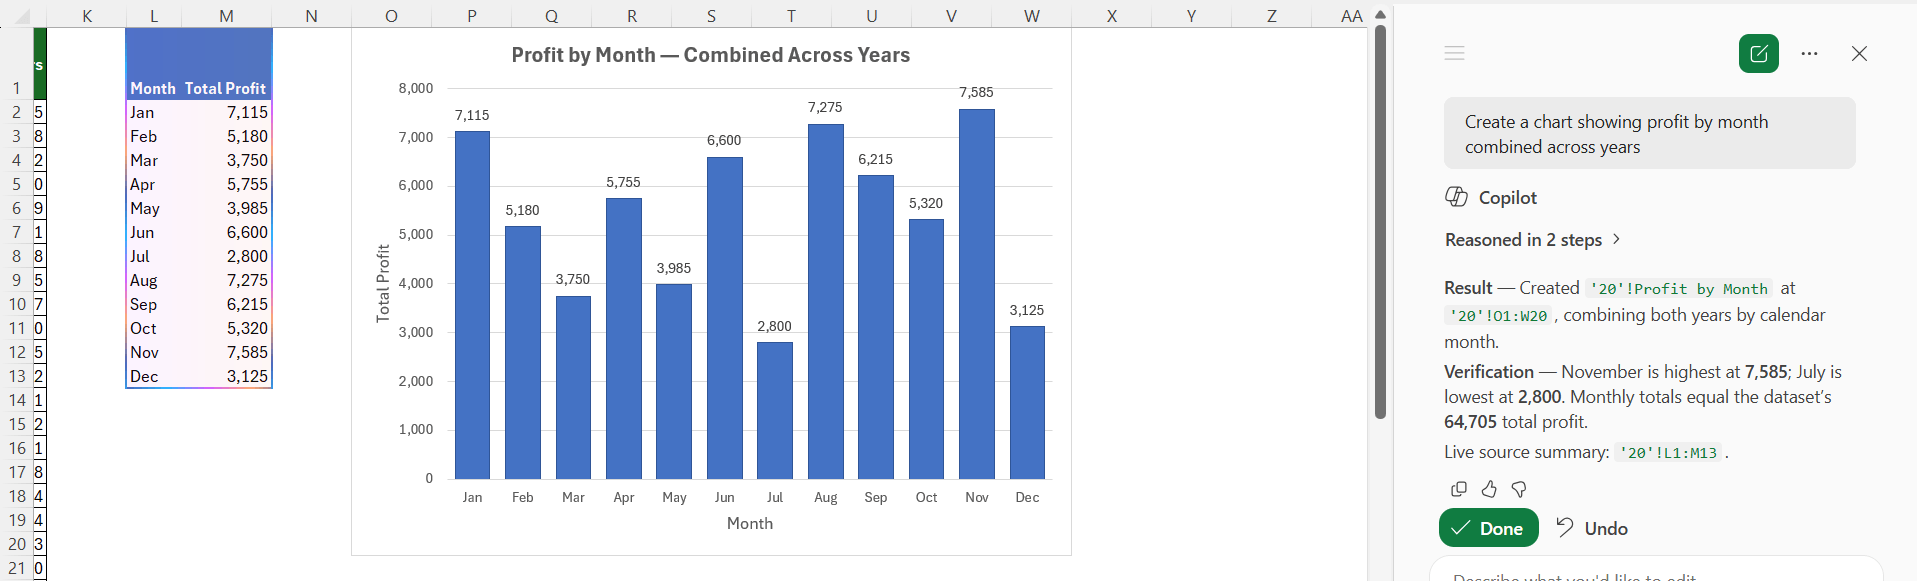
26. Create a profit chart
Create a chart showing profit by month combined across years.
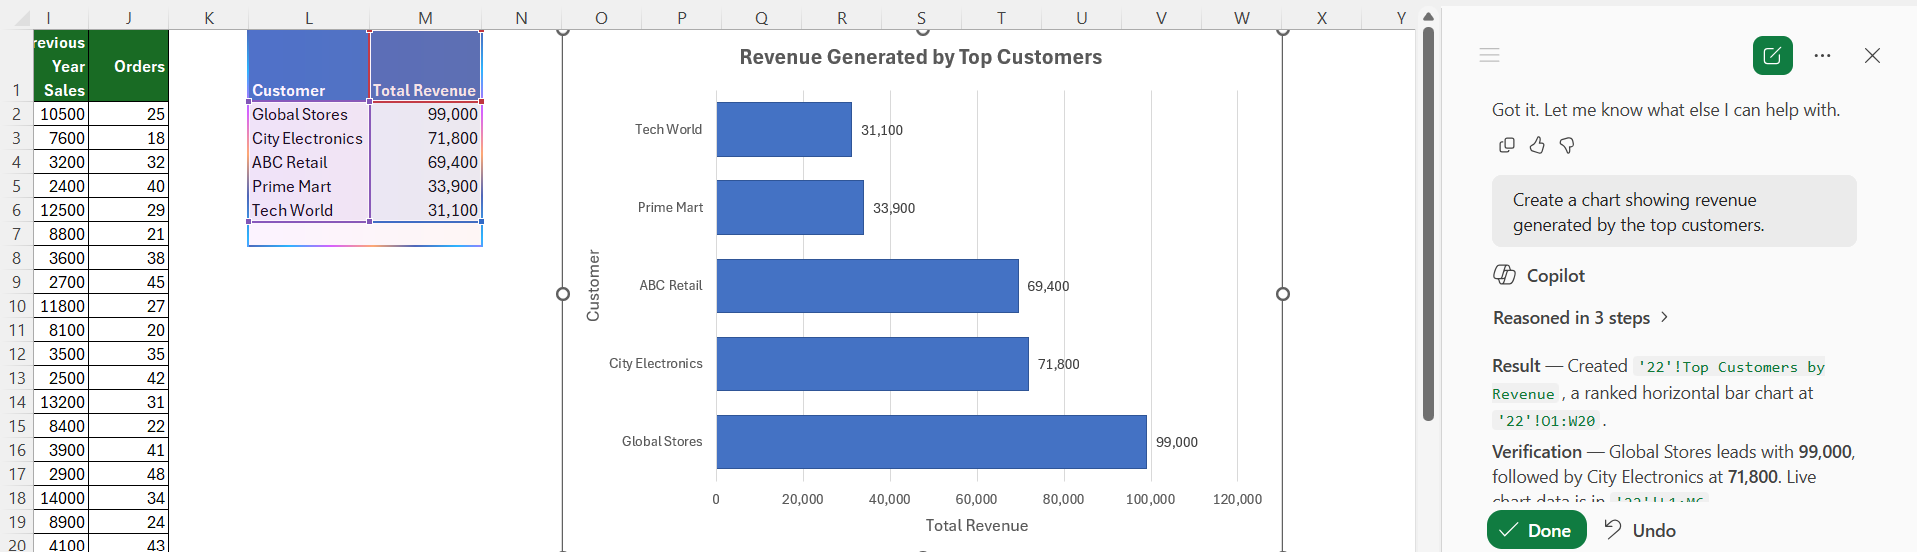
27. Create a customer chart
Create a chart showing revenue generated by the top customers.
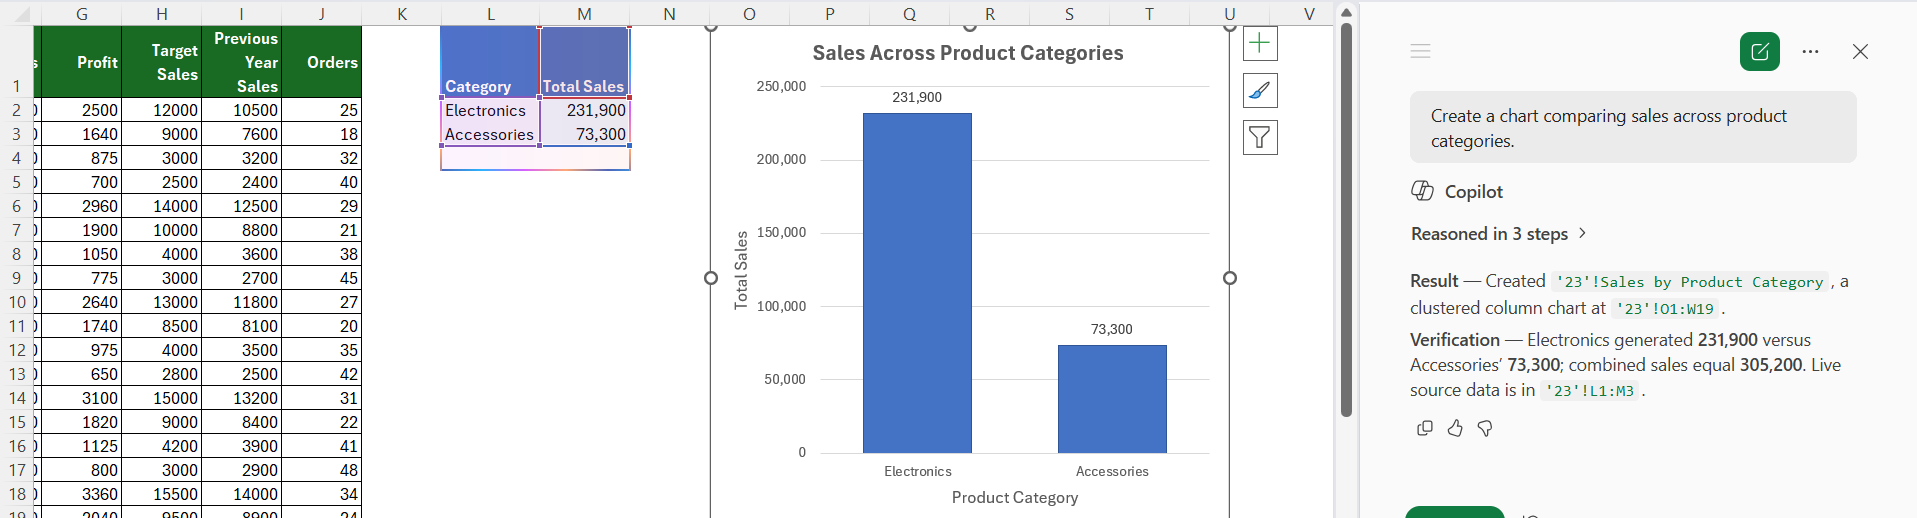
28. Visualize category performance
Create a chart comparing sales across product categories.
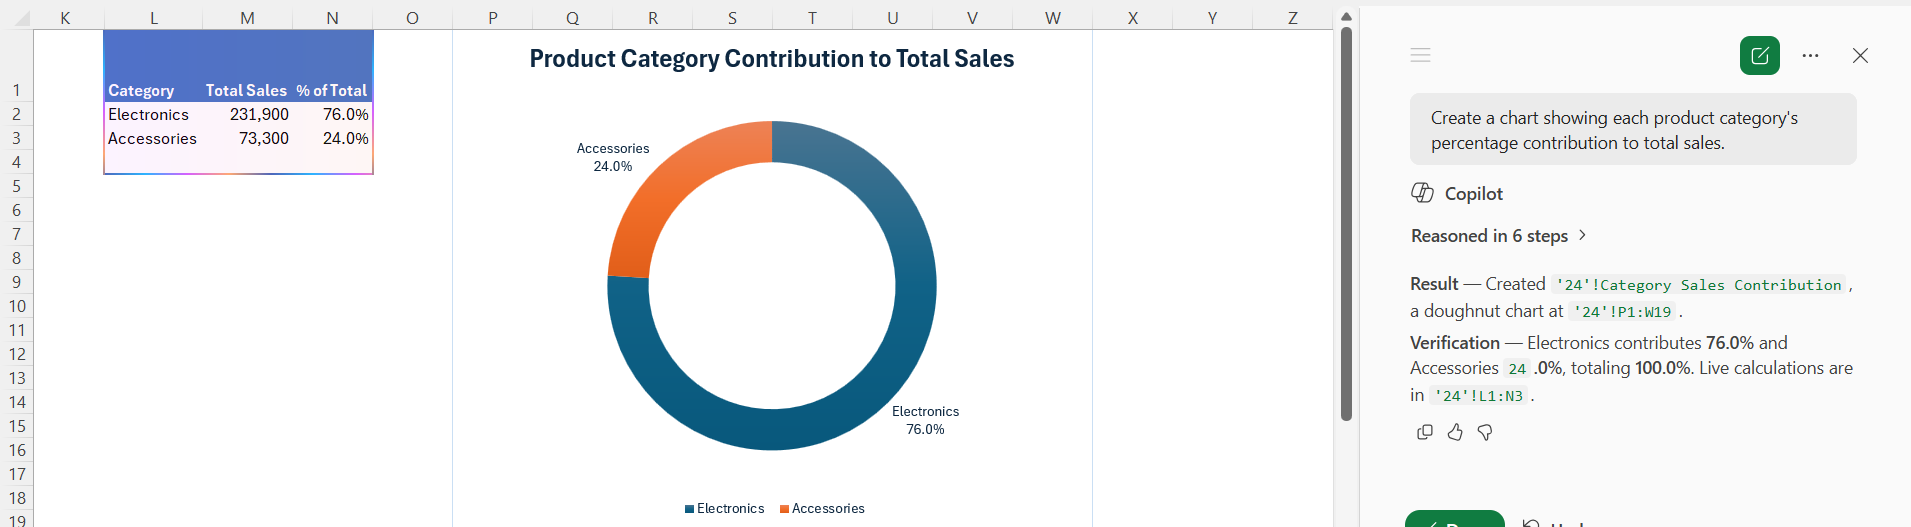
29. Show percentage contribution
Create a chart showing each product category’s percentage contribution to total sales.
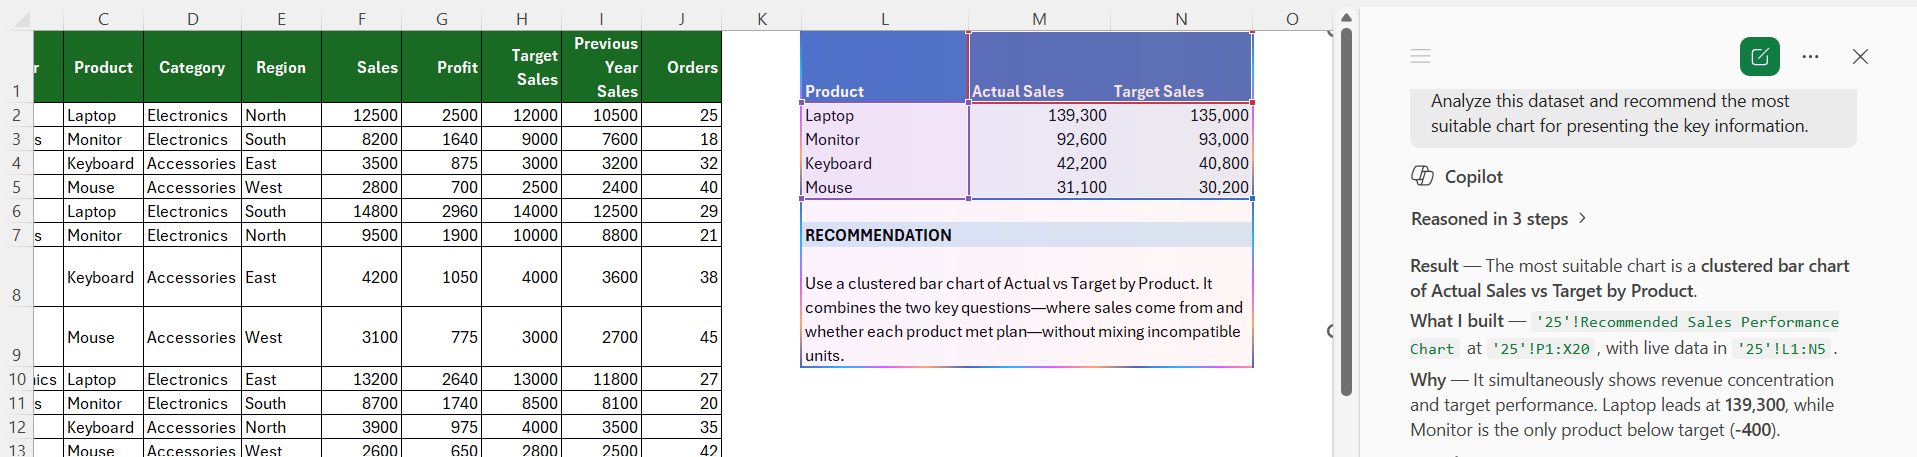
30. Recommend a chart
Analyze this dataset and recommend the most suitable chart for presenting the key information.
Data Cleaning Prompts
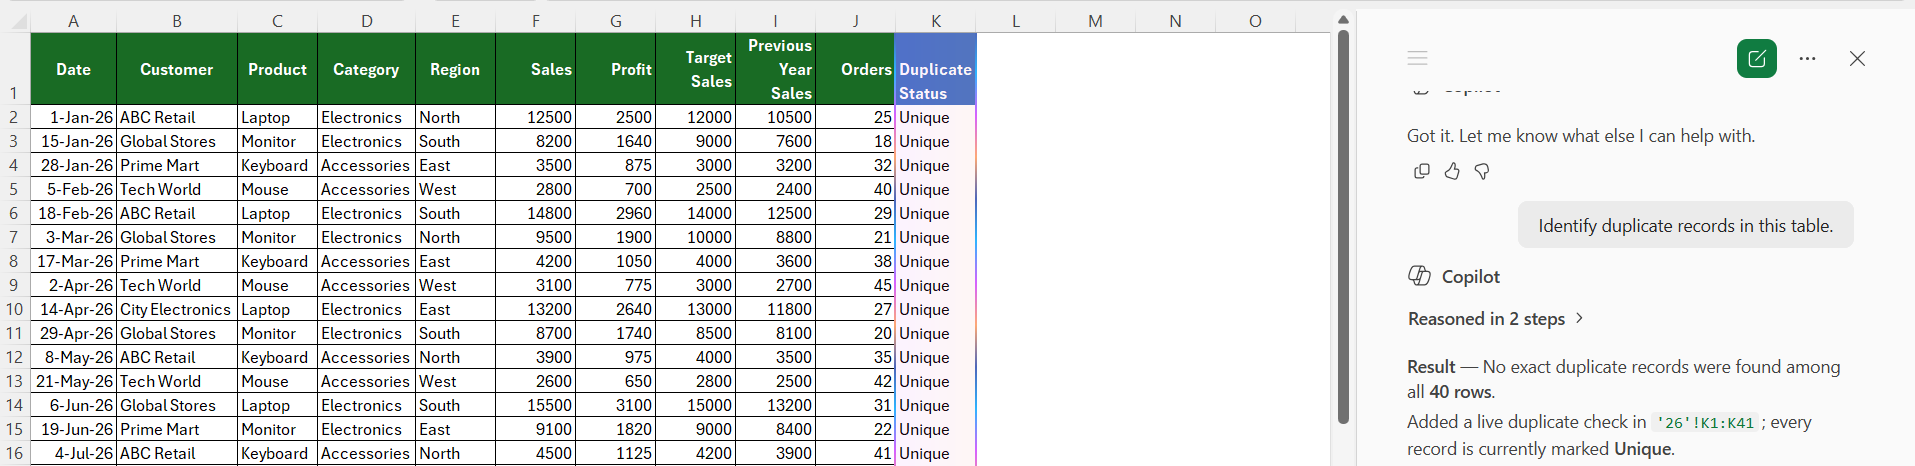
31. Find duplicate records
Identify duplicate records in this table.
32. Find missing values
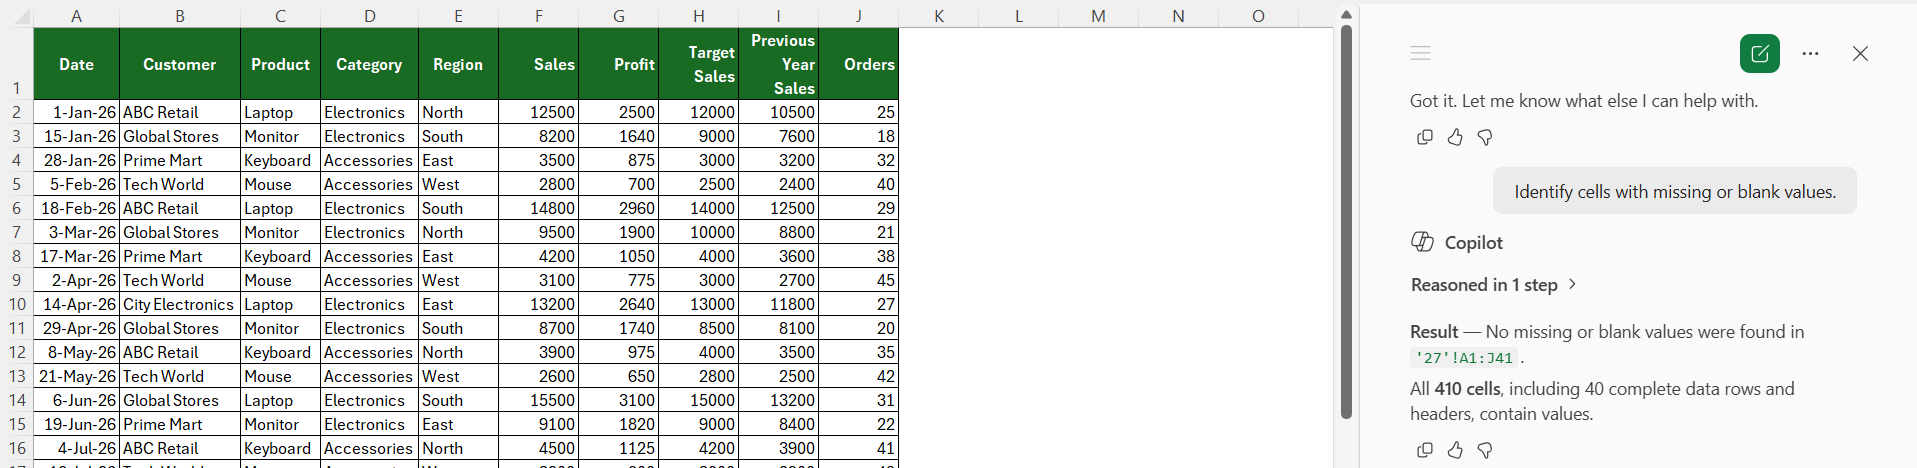
Identify cells with missing or blank values.
33. Standardize names
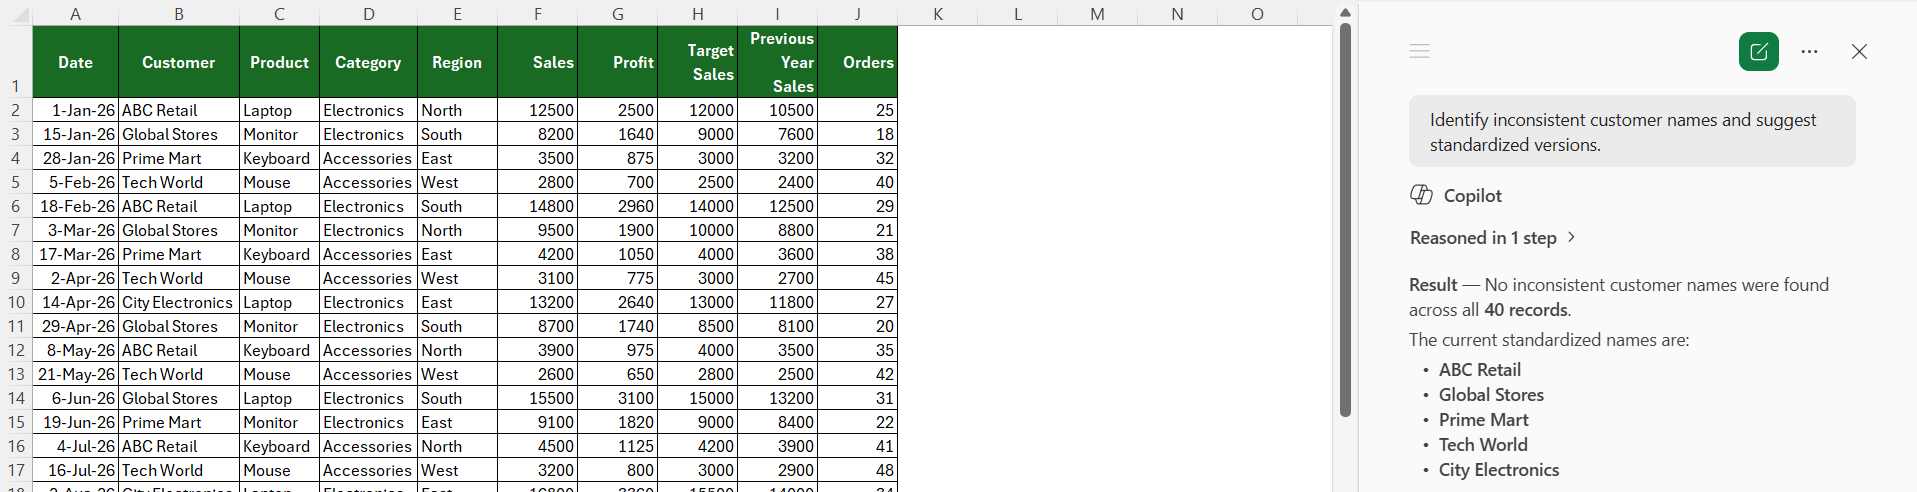
Identify inconsistent customer names and suggest standardized versions.
34. Clean formatting
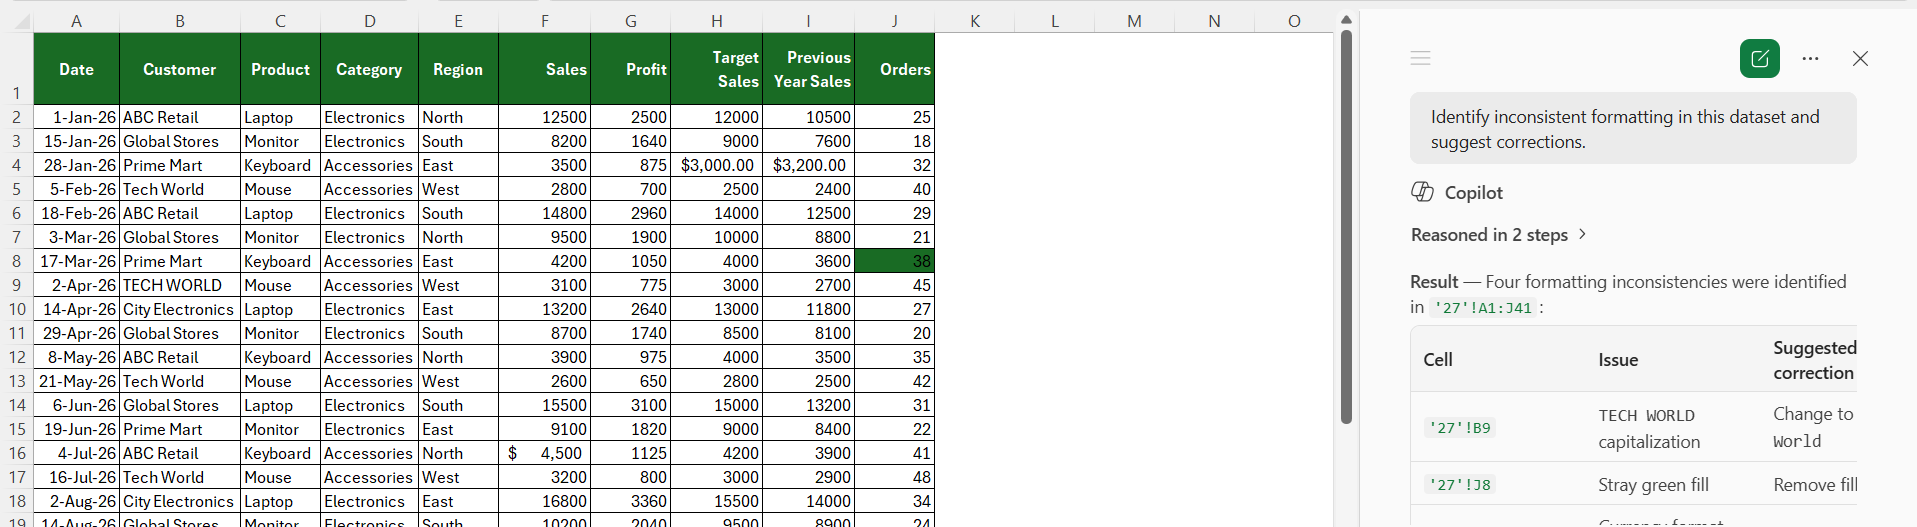
Identify inconsistent formatting in this dataset and suggest corrections.
35. Find incorrect data
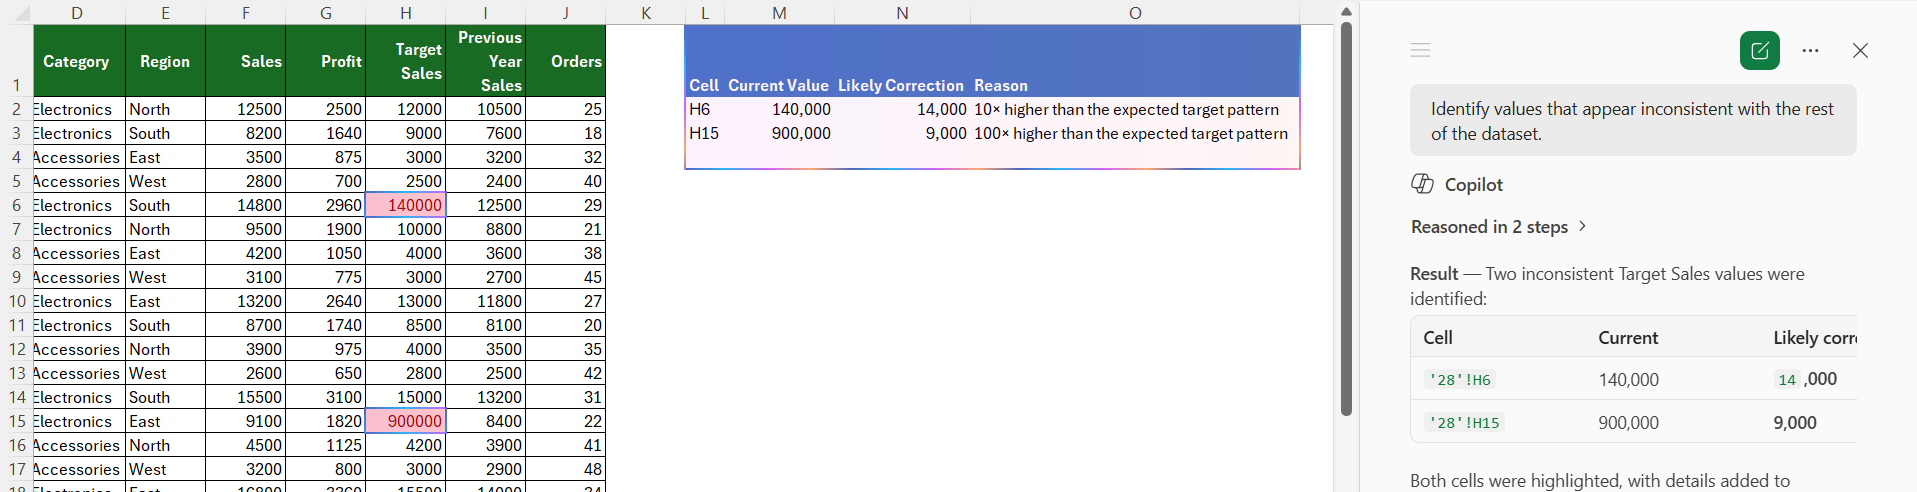
Identify values that appear inconsistent with the rest of the dataset.
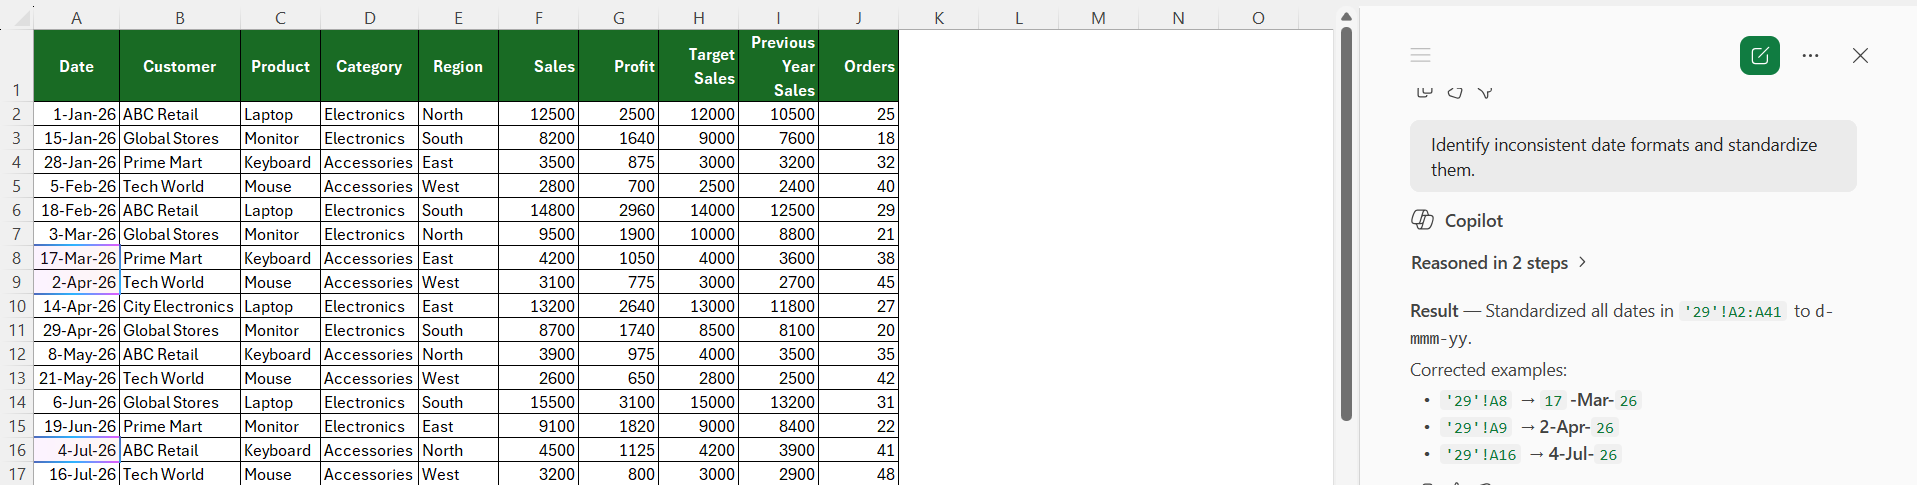
36. Standardize dates
Identify inconsistent date formats and standardize them.
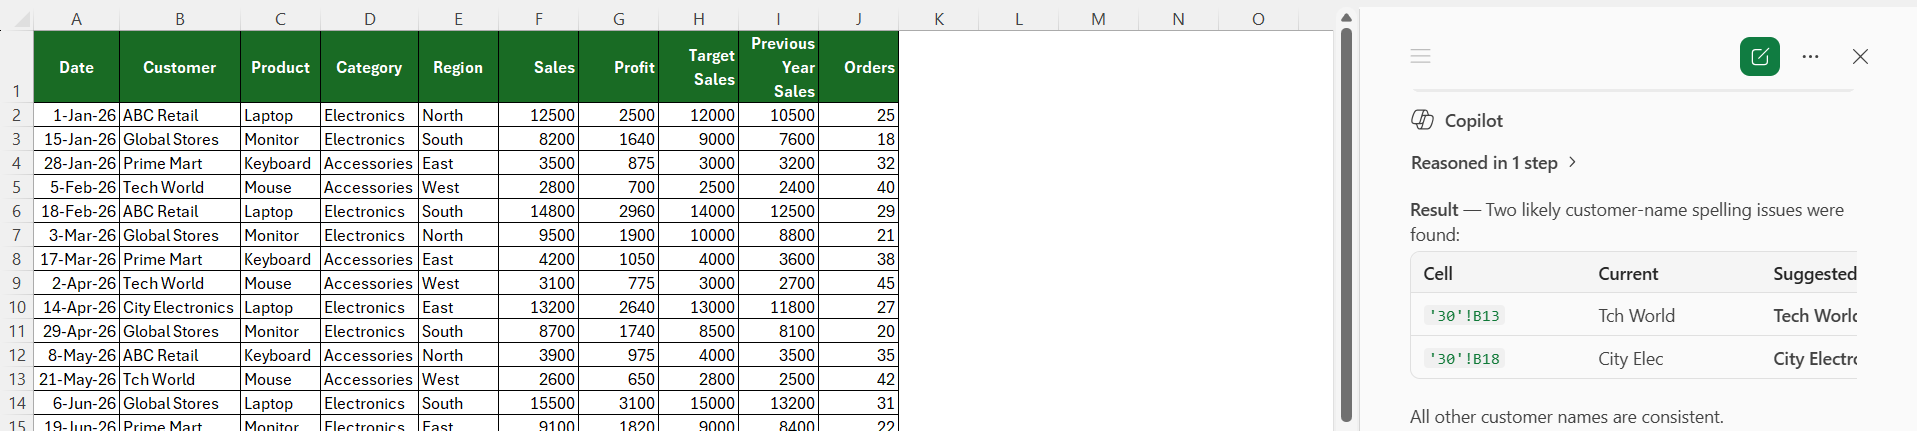
37. Find spelling inconsistencies
Identify possible spelling mistakes in the customer names.
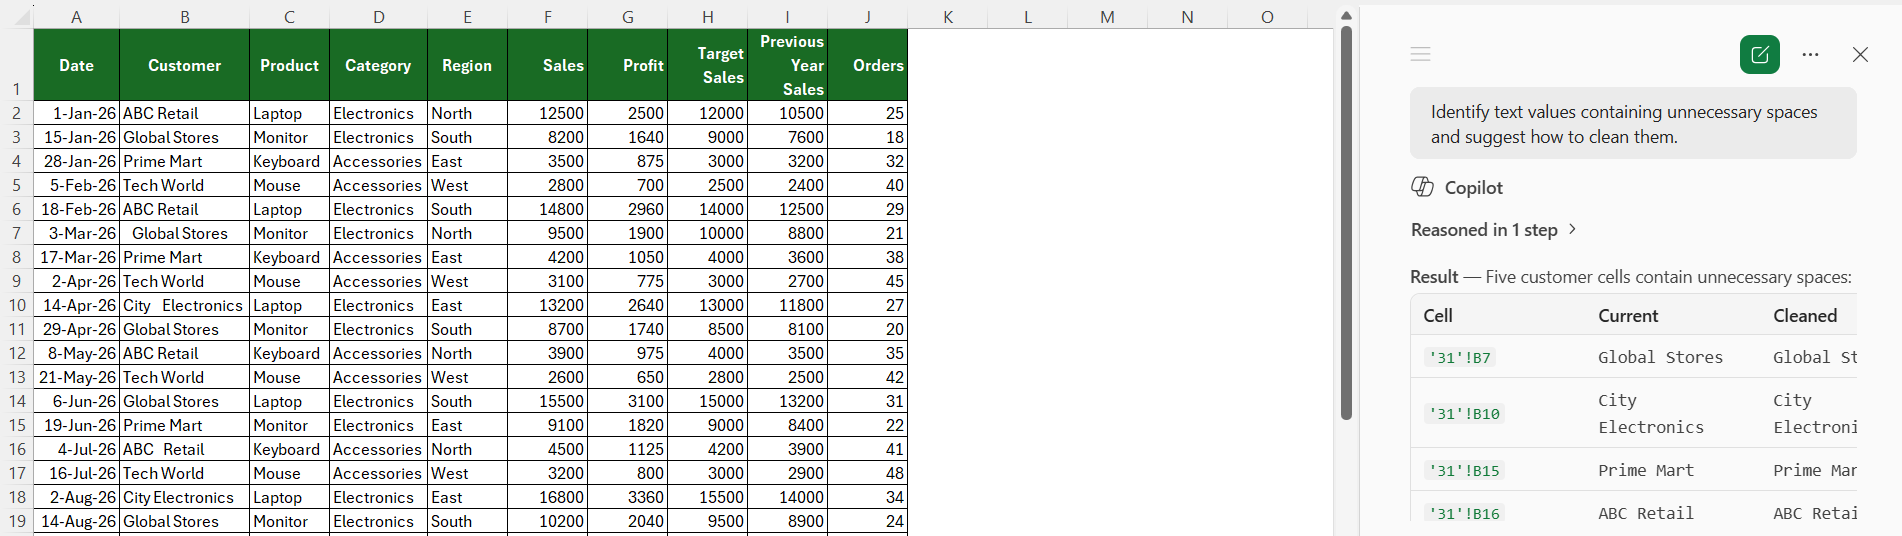
38. Clean unnecessary spaces
Identify text values containing unnecessary spaces and suggest how to clean them.
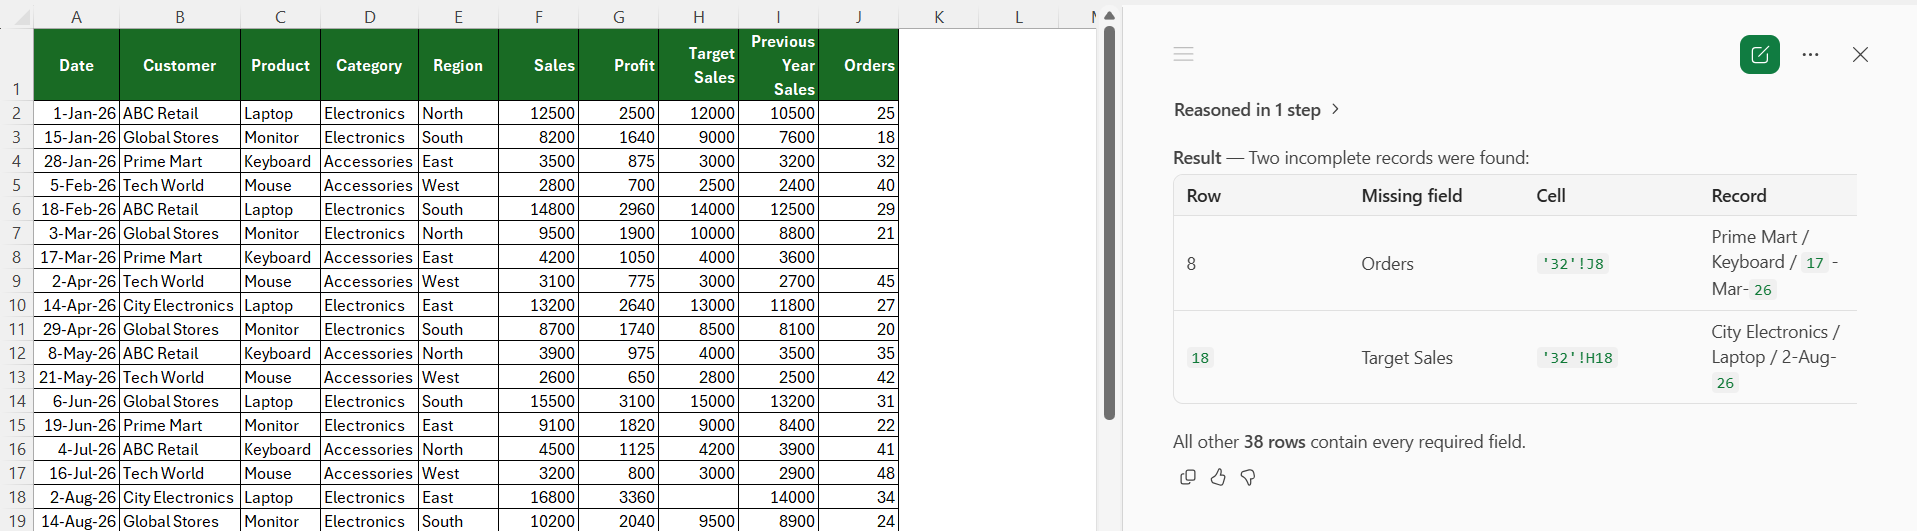
39. Identify incomplete records
Find rows where important information is missing.
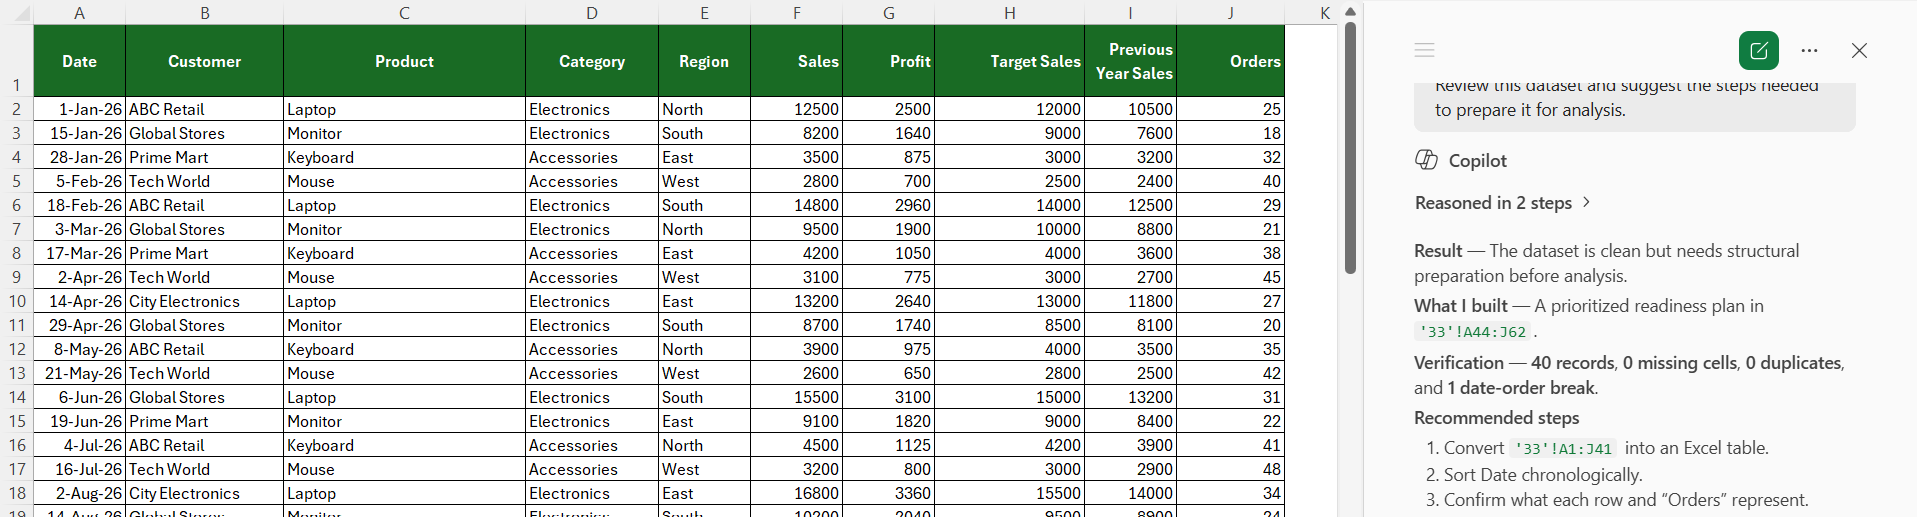
40. Prepare the data
Review this dataset and suggest the steps needed to prepare it for analysis.
Reporting and Productivity Prompts
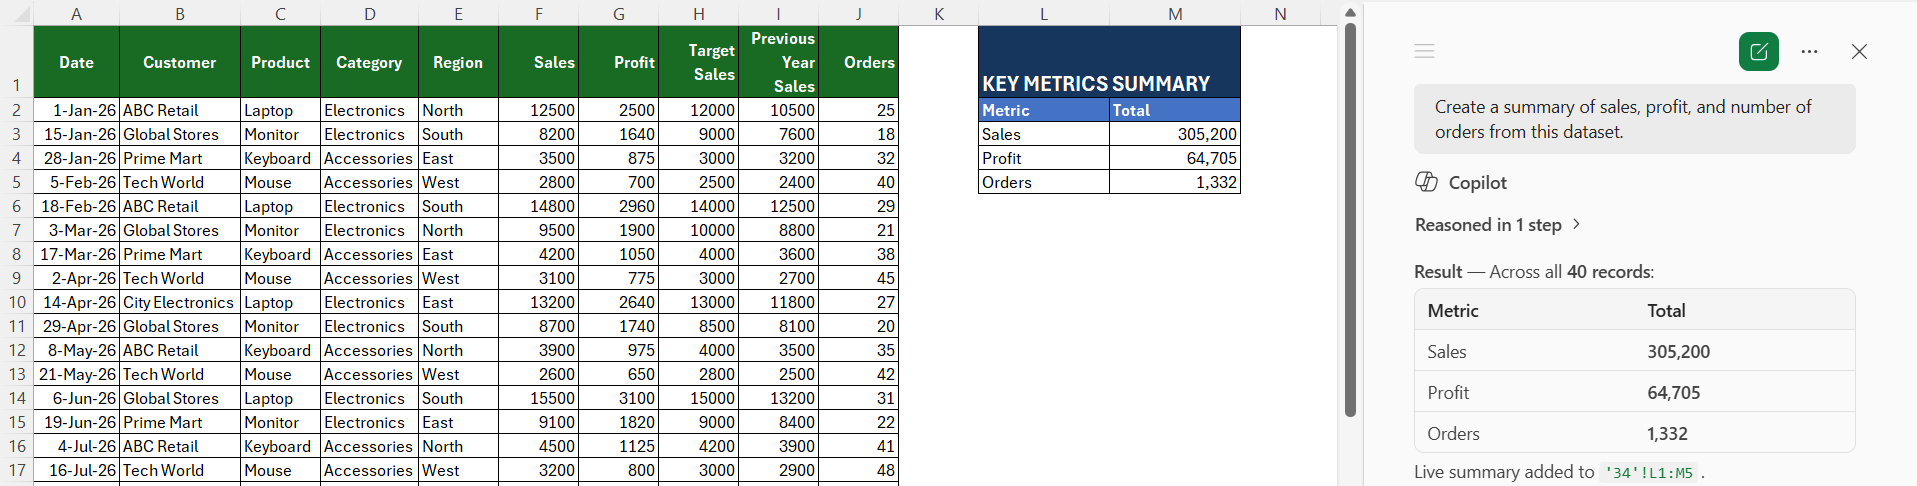
41. Create a summary report
Create a summary of sales, profit, and number of orders from this dataset.
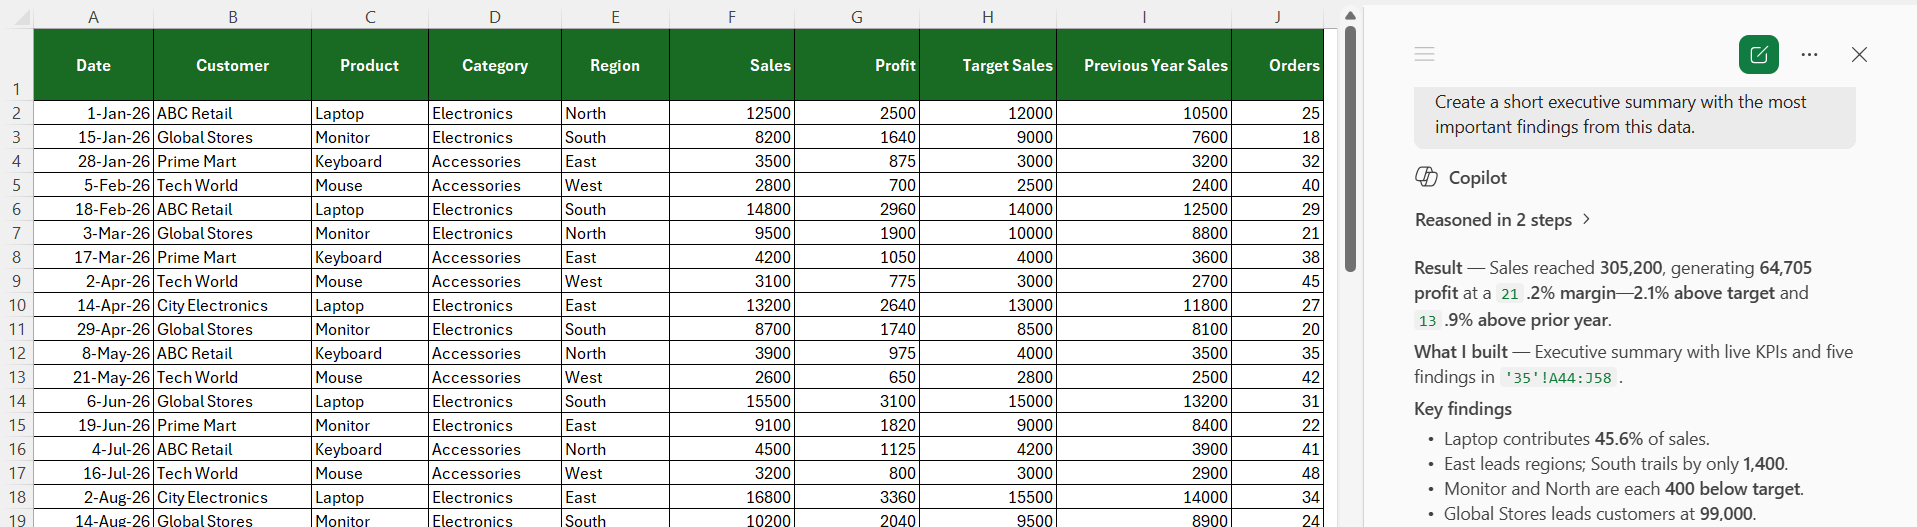
42. Create an executive summary
Create a short executive summary with the most important findings from this data.
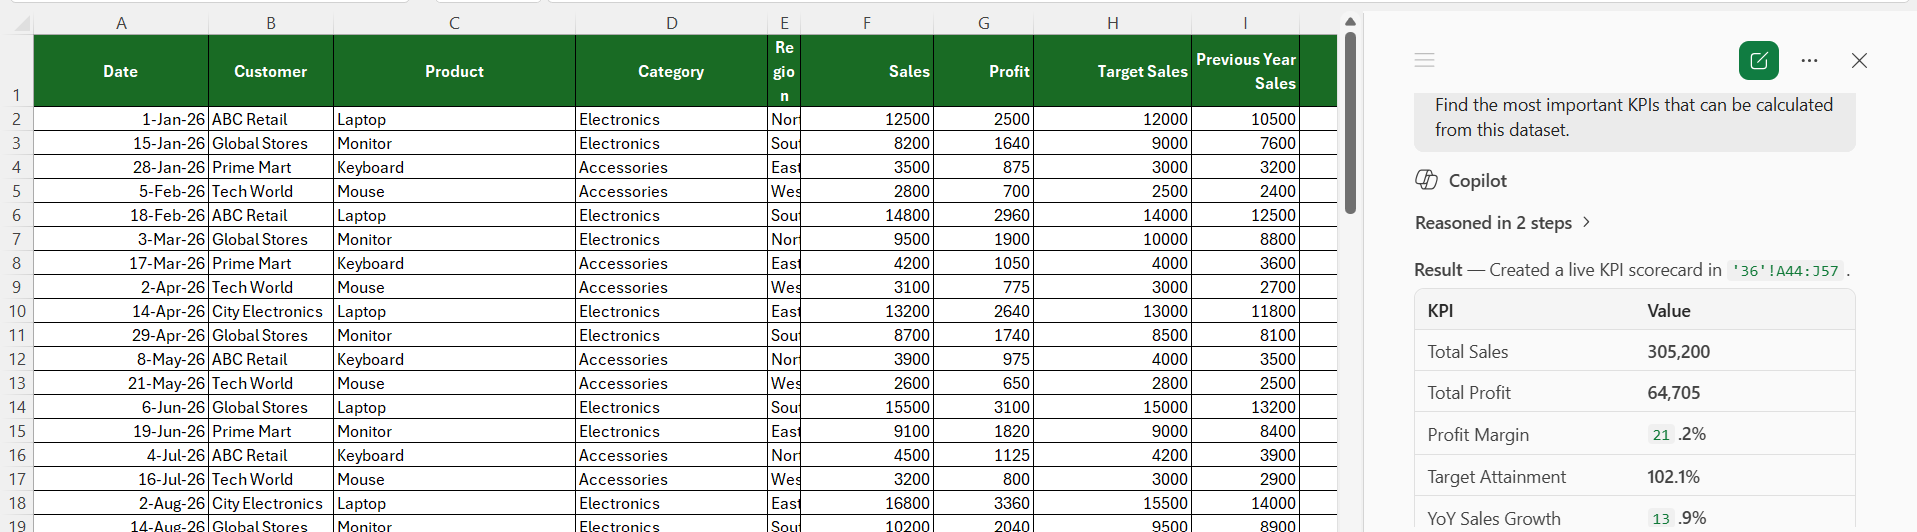
43. Find key performance indicators
Find the most important KPIs that can be calculated from this dataset.
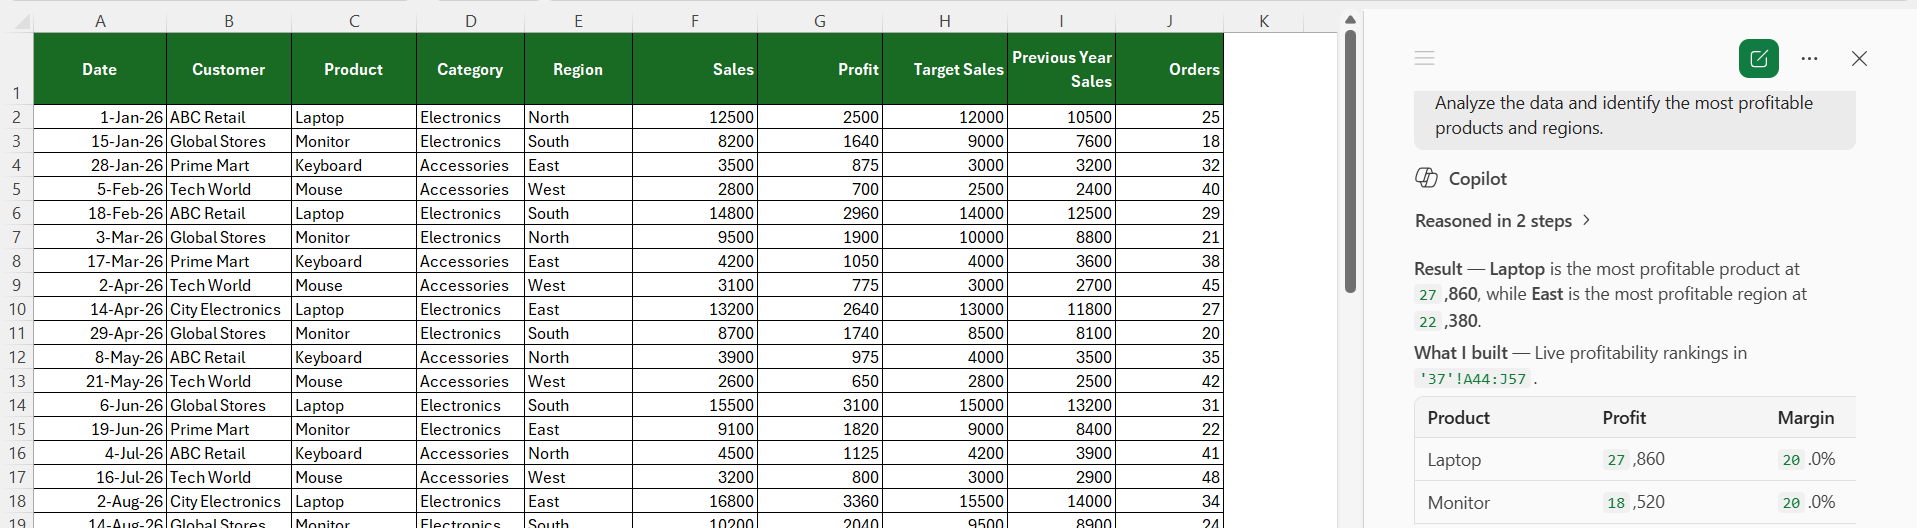
44. Analyze profitability
Analyze the data and identify the most profitable products and regions.
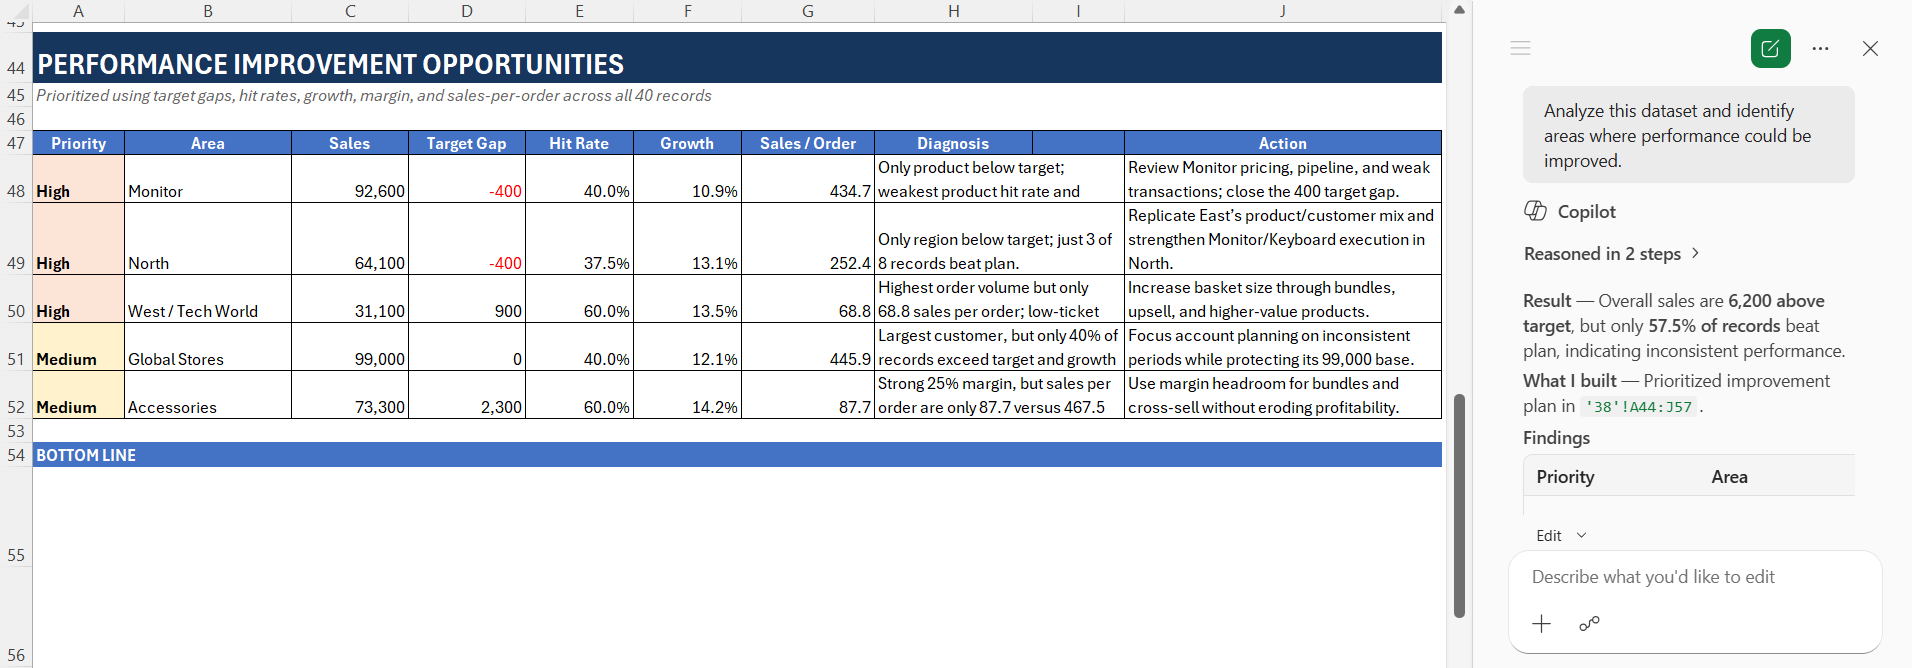
45. Find areas for improvement
Analyze this dataset and identify areas where performance could be improved.
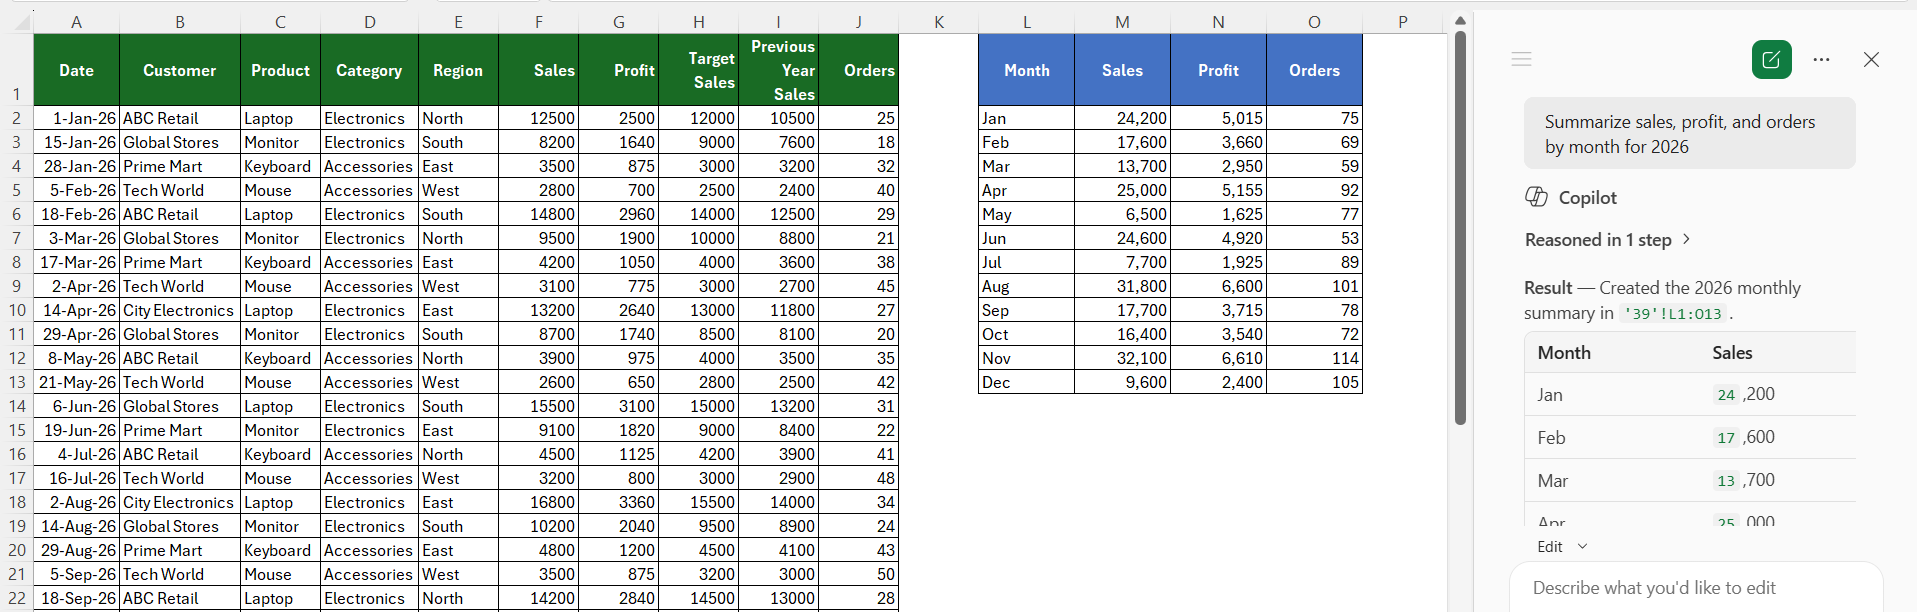
46. Create a monthly report
Summarize sales, profit, and orders by month.
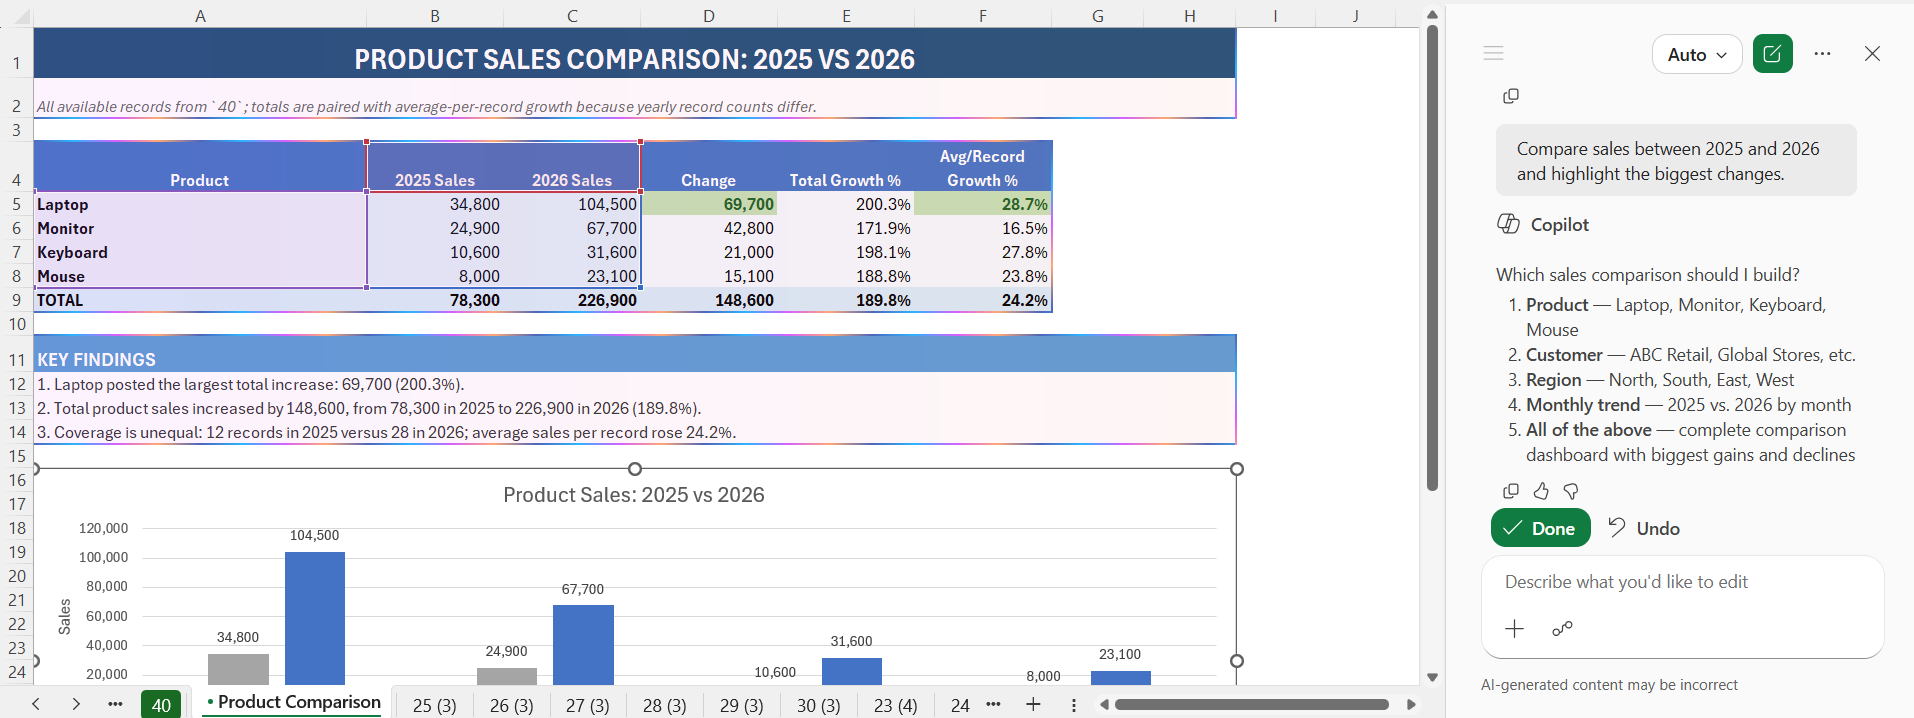
47. Compare two periods
Compare sales between 2025 and 2026 and highlight the biggest changes.
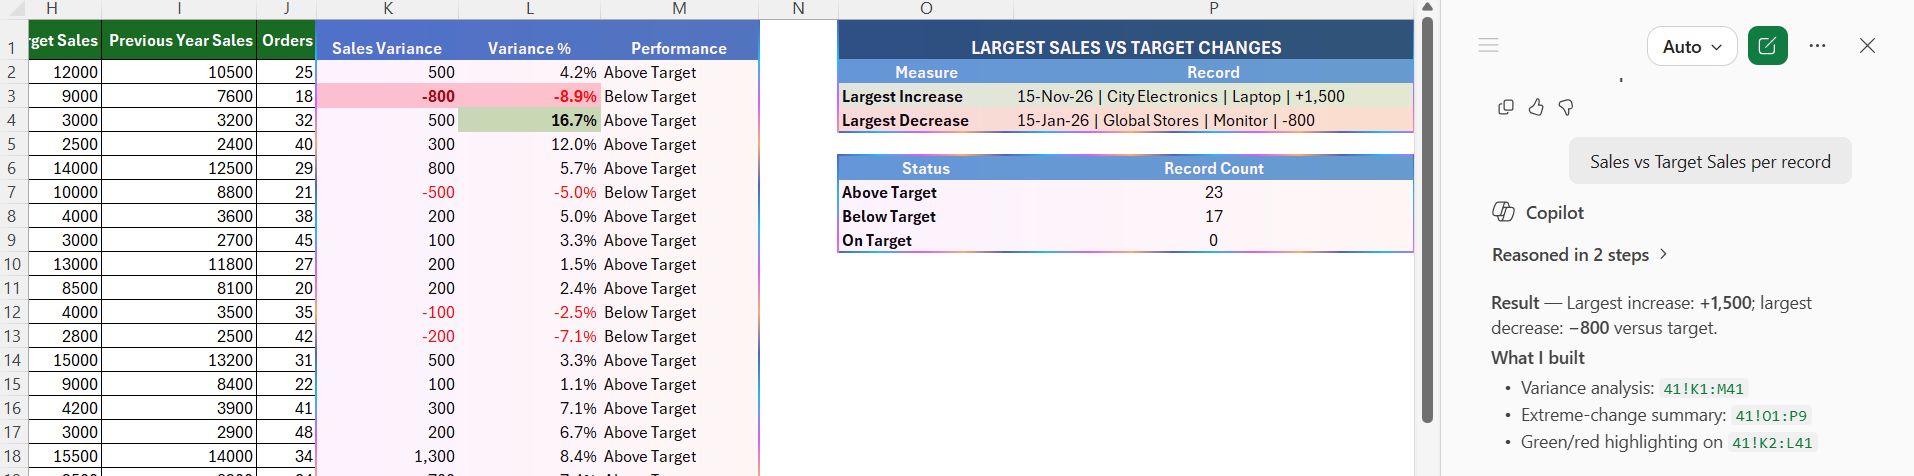
48. Find important changes
Identify the largest increases and decreases in the dataset.
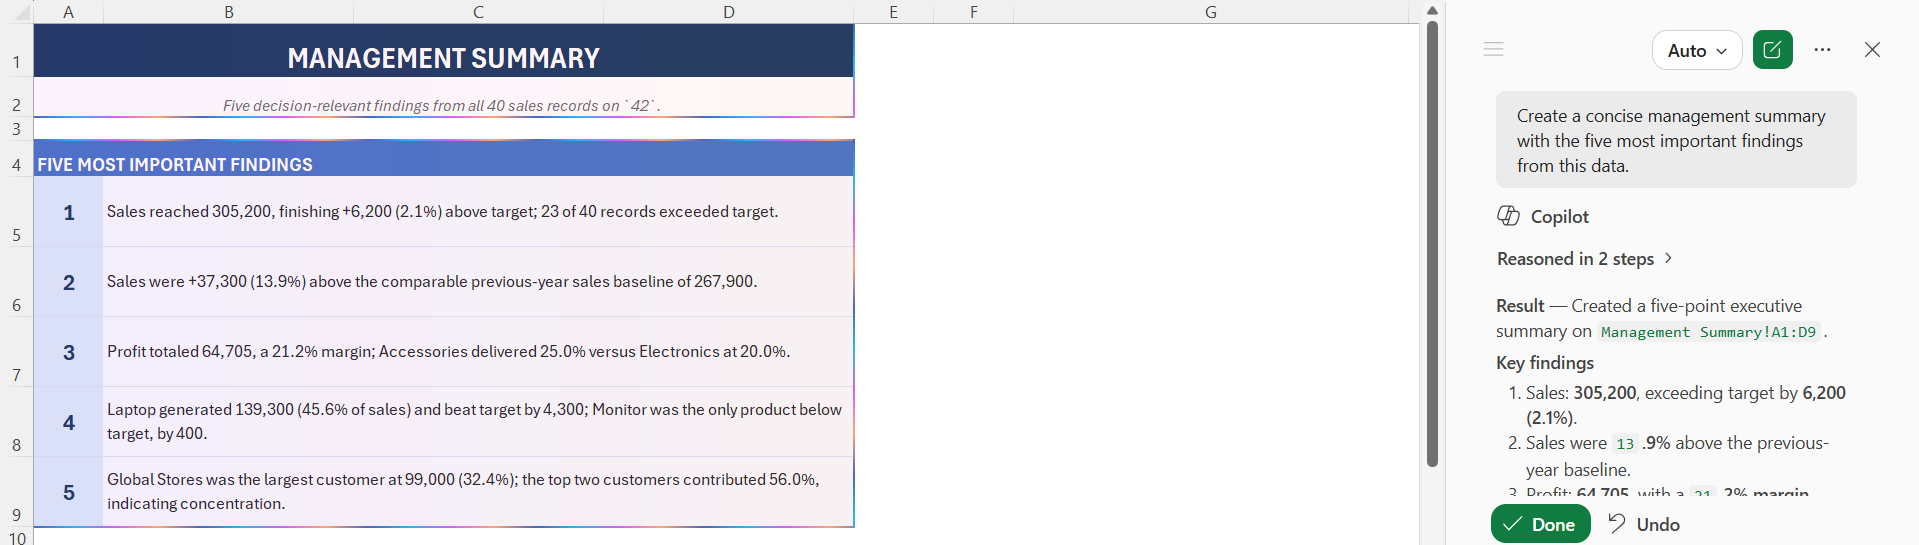
49. Create a management summary
Create a concise management summary with the five most important findings from this data.
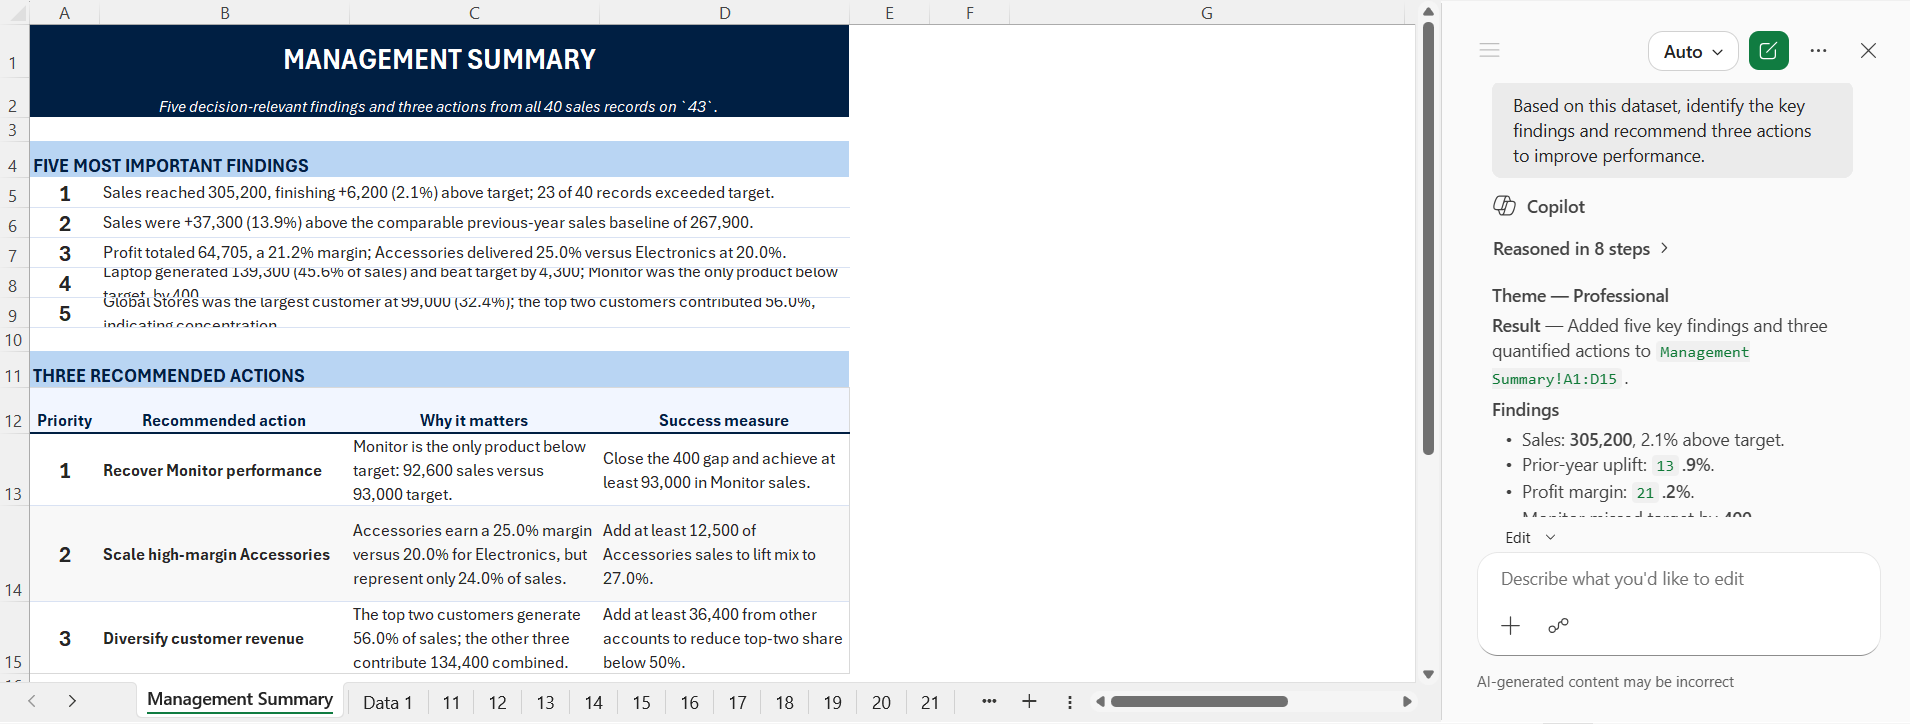
50. Recommend next steps
Based on this dataset, identify the key findings and recommend three actions to improve performance.
FAQs
1. What are Copilot prompts in Excel?
Microsoft Copilot prompts are natural-language instructions that tell Copilot what you want to do with your Excel data.
2. Can Copilot create Excel formulas?
Yes. You can ask Copilot to create formulas for calculations such as totals, averages, percentages, and growth rates.
3. Can Copilot create charts in Excel?
Yes. Copilot can help create charts based on your data, including bar charts, line charts, and other visualizations.
4. Can Copilot clean Excel data?
Yes. You can use Copilot to identify duplicates, missing values, inconsistent formatting, spelling issues, and other data problems.
5. How can I get better results from Copilot prompts?
You should use clear and specific instructions to get better results from Copilot prompts. Make sure that you mention the data, calculation, time period, and desired output.

John Michaloudis is a former accountant and finance analyst at General Electric, a Microsoft MVP since 2020, an Amazon #1 bestselling author of 4 Microsoft Excel books and teacher of Microsoft Excel & Office over at his flagship MyExcelOnline Academy Online Course.

 30 Days - Full Access