Excel charts can help you visualise data and identify patterns. You can use Microsoft Copilot to create these charts easily by writing the prompt in simple language instead of manually creating them. In this article, you will learn how to create charts with Copilot in Excel.
Key Takeaways:
- Copilot helps you create Excel charts using simple text prompts.
- Your data should be organized in a table with column headers.
- The workbook must be saved on OneDrive or SharePoint.
- Copilot can create different chart types, including bar, line, and pie charts.
- You can review and insert the chart directly into your worksheet.
Table of Contents
Introduction to Copilot
What is Copilot?
Microsoft Copilot is an AI-powered assistant developed by Microsoft that helps users complete tasks faster and more easily. It works across Microsoft applications like Microsoft Excel, Microsoft Word, Microsoft PowerPoint, and Microsoft Outlook.
Copilot uses artificial intelligence to understand simple text commands and perform tasks automatically. Users can ask Copilot to create formulas, summarize documents, generate charts, write emails, analyze data, and much more.
Requirements for Copilot
- You have a Microsoft 365 subscription.
- Data is organised in a table with headers.
- Workbook is saved on OneDrive or SharePoint.
Why use Copilot for Charts?
It may take time to create charts manually if you are not familiar with the Chart tools. Copilot simplifies this process.
- It helps you create charts in seconds.
- You do not need Excel knowledge to create one.
- Copilot can suggest chart types that fit your data.
- You spend less time creating the chart and more time analysing it.
Create Charts with Copilot
Step-by-Step Guide
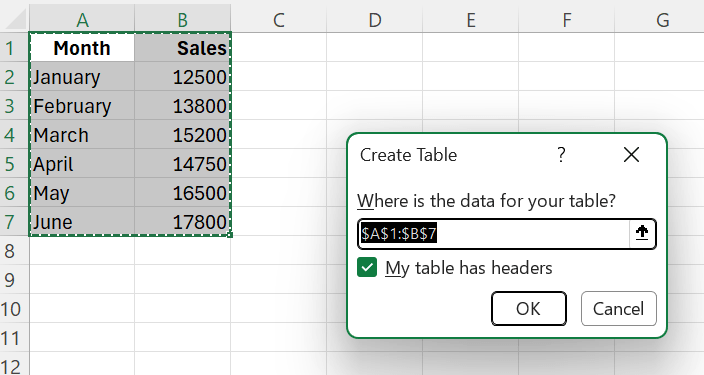
STEP 1: Select the dataset.
STEP 2: Press Ctrl + T to convert it to a table.
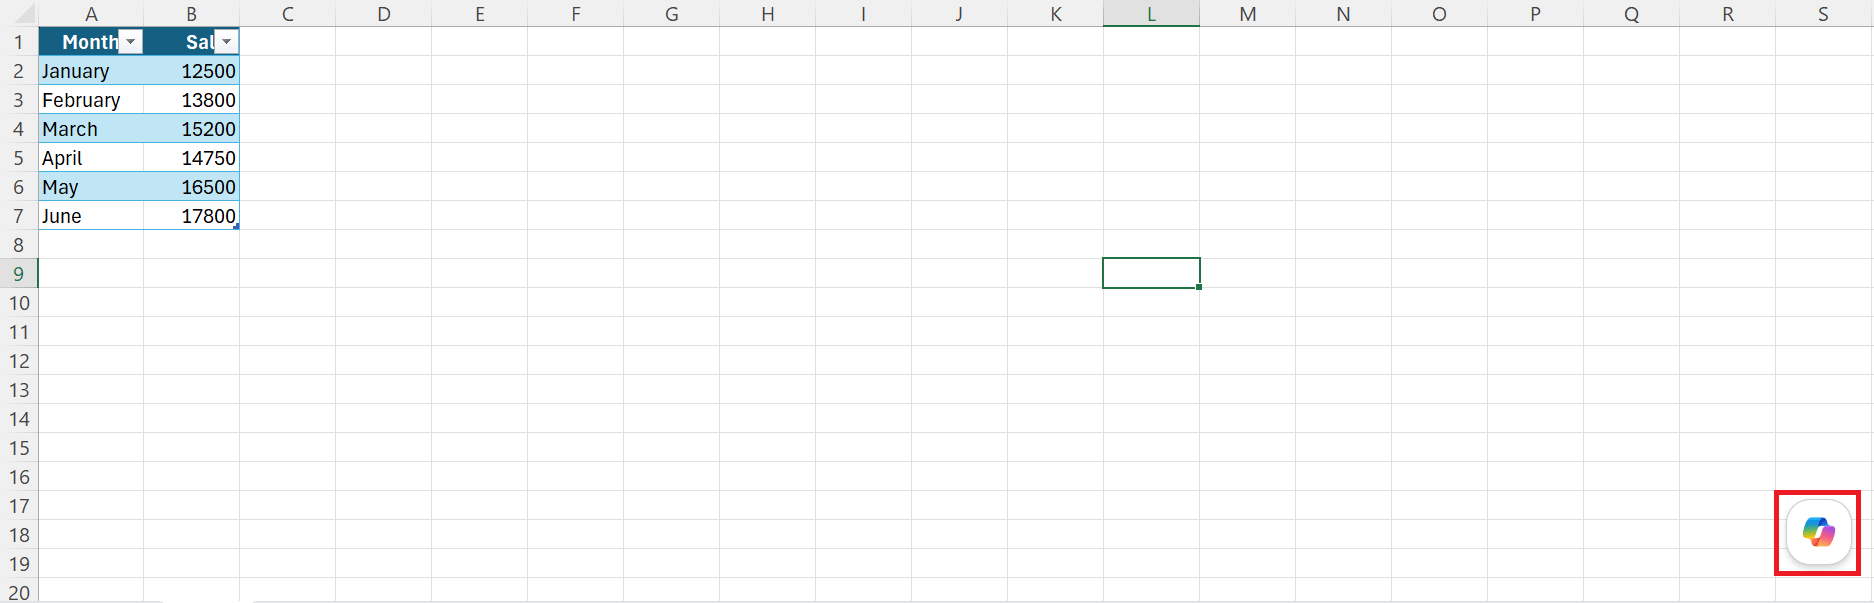
STEP 3: Click on the Copilot button in the worksheet.
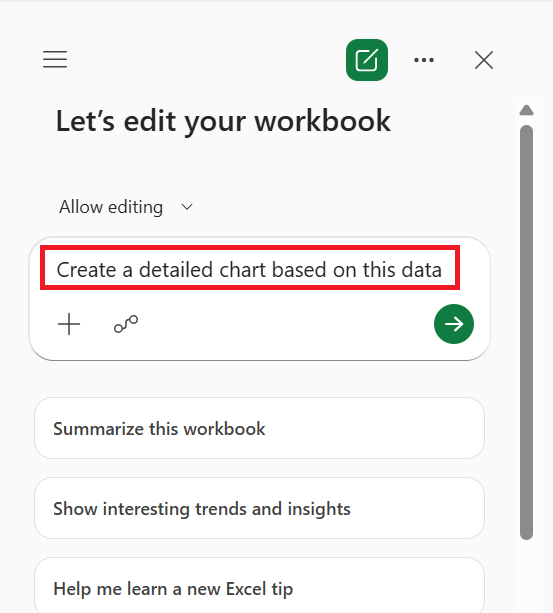
STEP 4: Type a prompt describing the chart you want to create.
Copilot analyzes your data and generates a chart based on your request. Review the chart to ensure it represents the data correctly.
STEP 5: Click Done to place the chart into your worksheet.
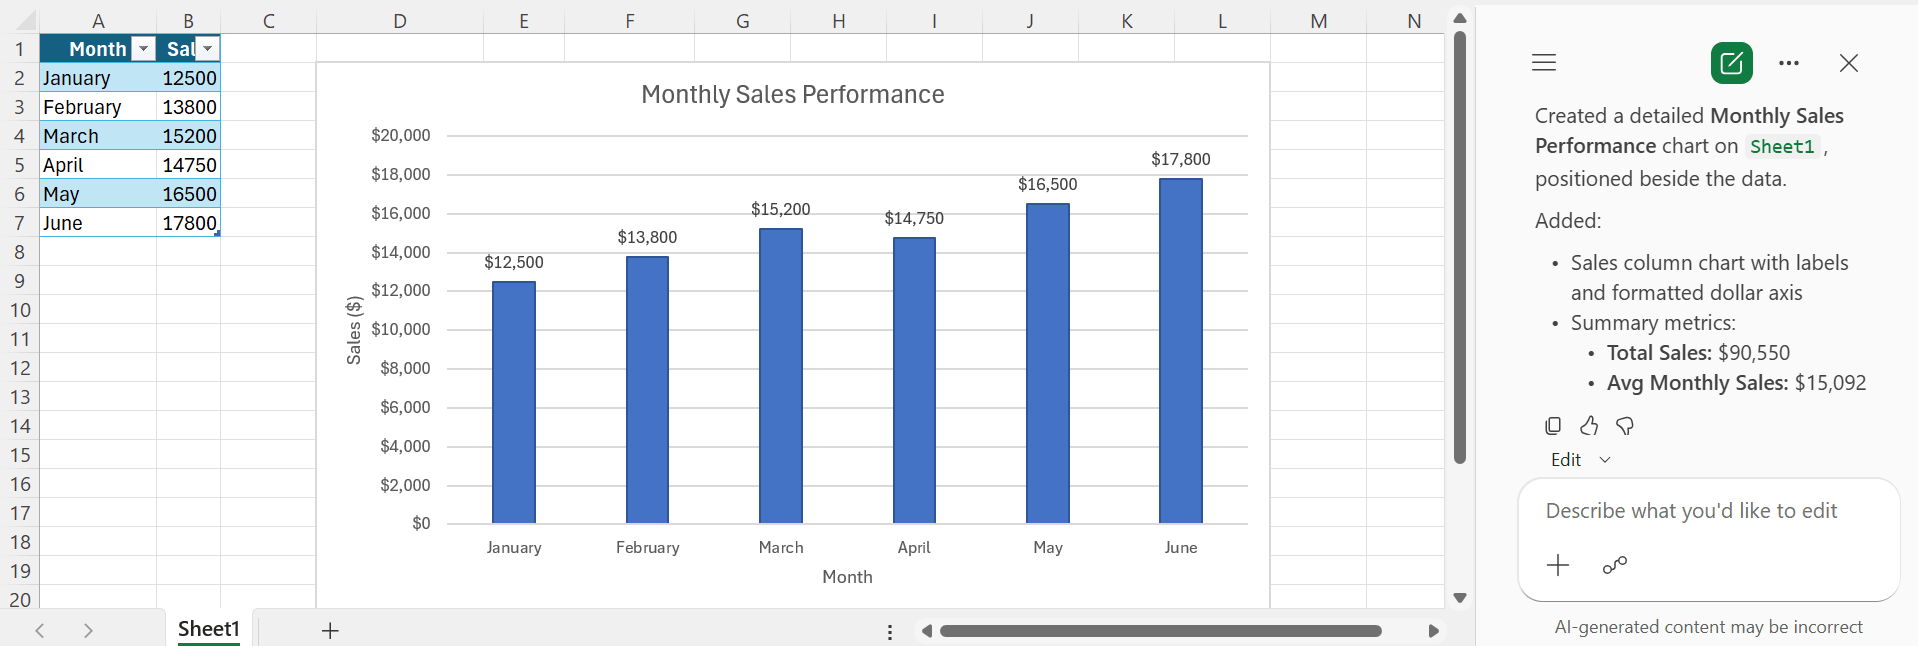
Chart Types You Can Create with Copilot
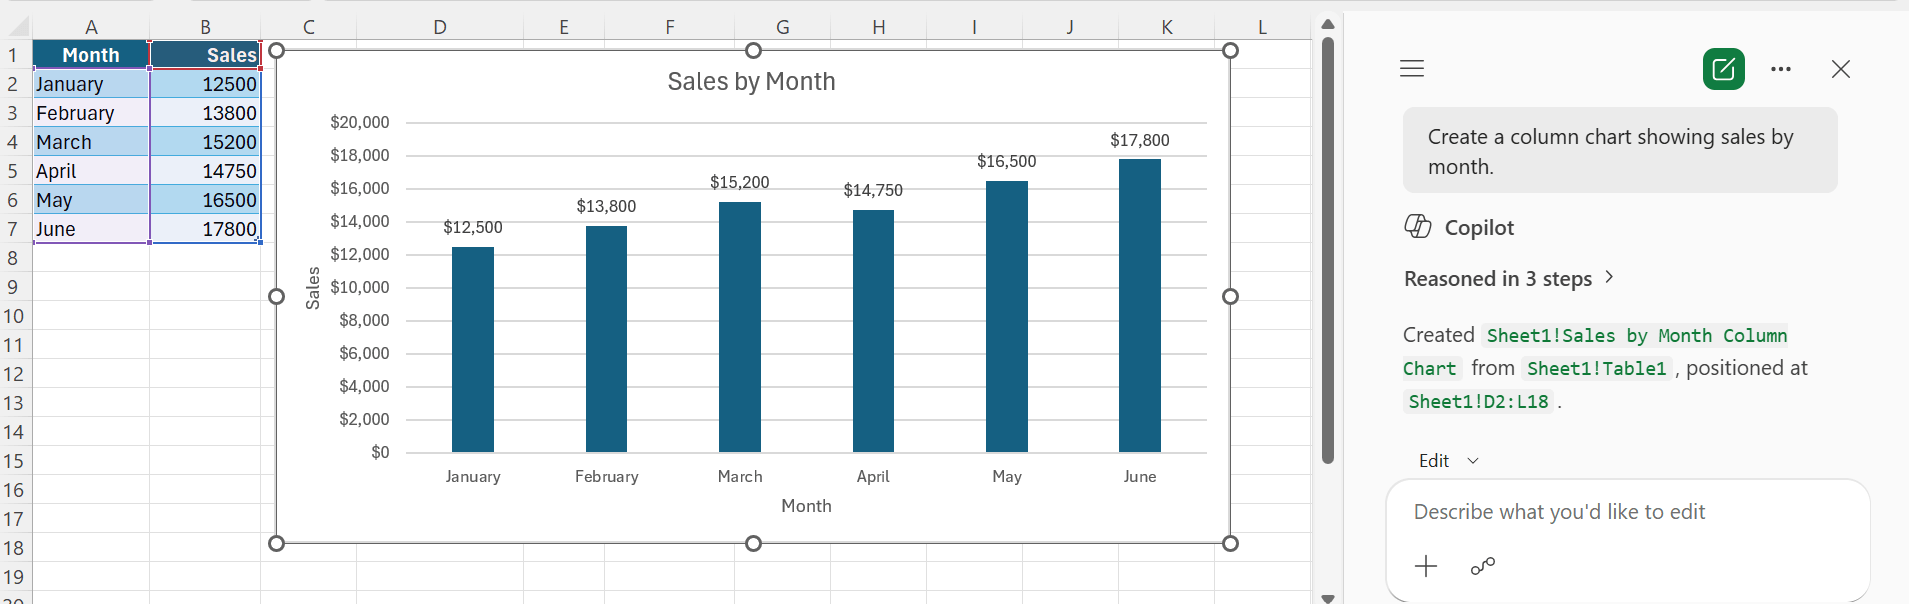
Column Charts
“Create a column chart showing sales by month.”
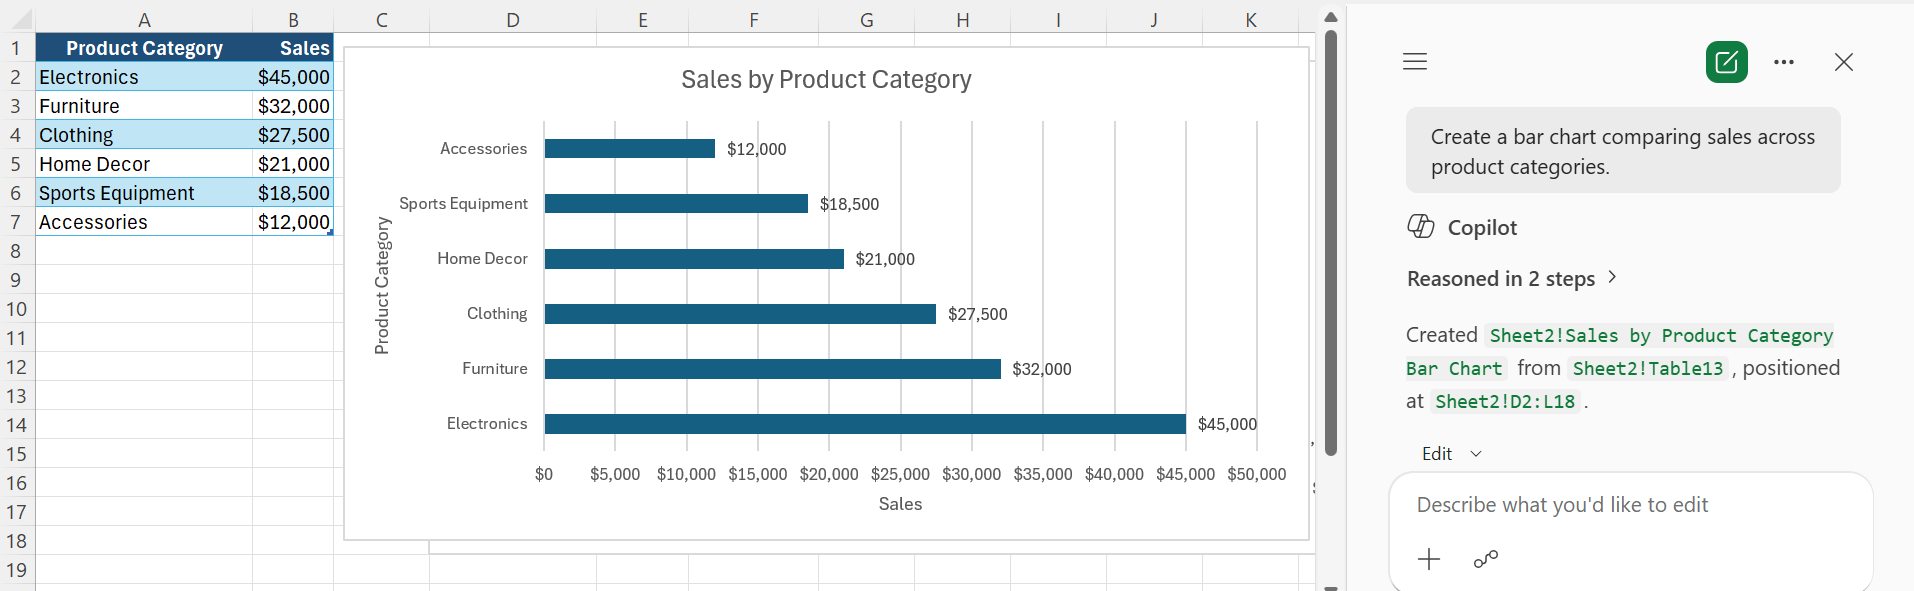
Bar Charts
“Create a bar chart comparing sales across product categories.”
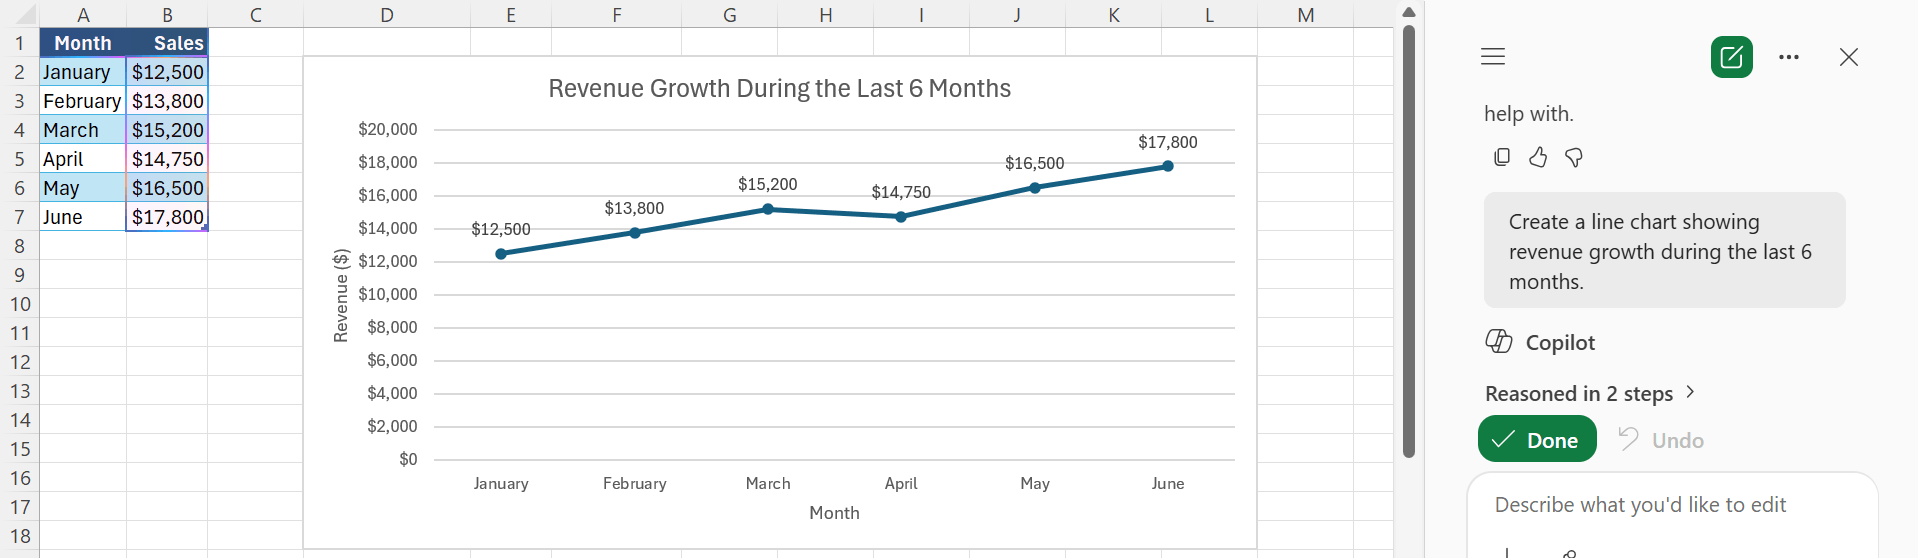
Line Charts
“Create a line chart showing revenue growth during the last 6 months.”
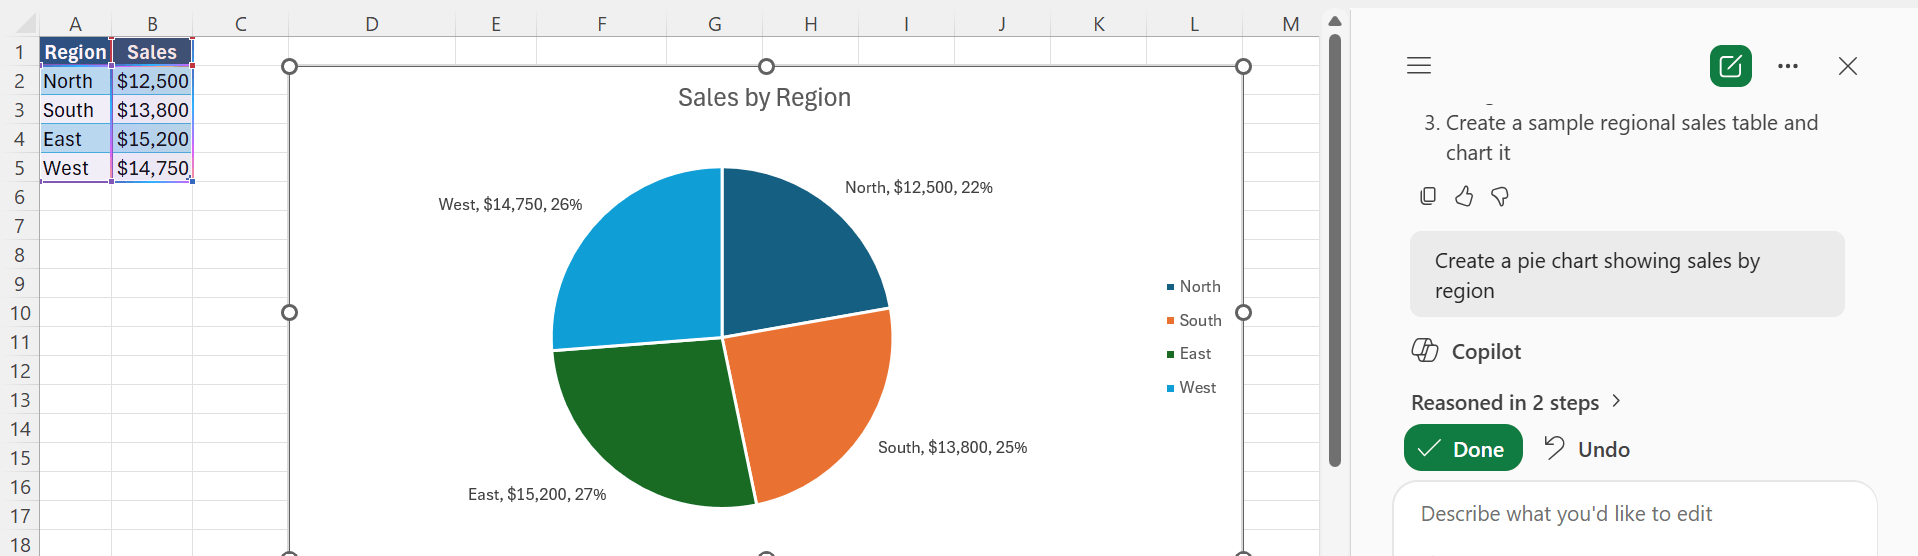
Pie Charts
“Create a pie chart showing sales by region.”
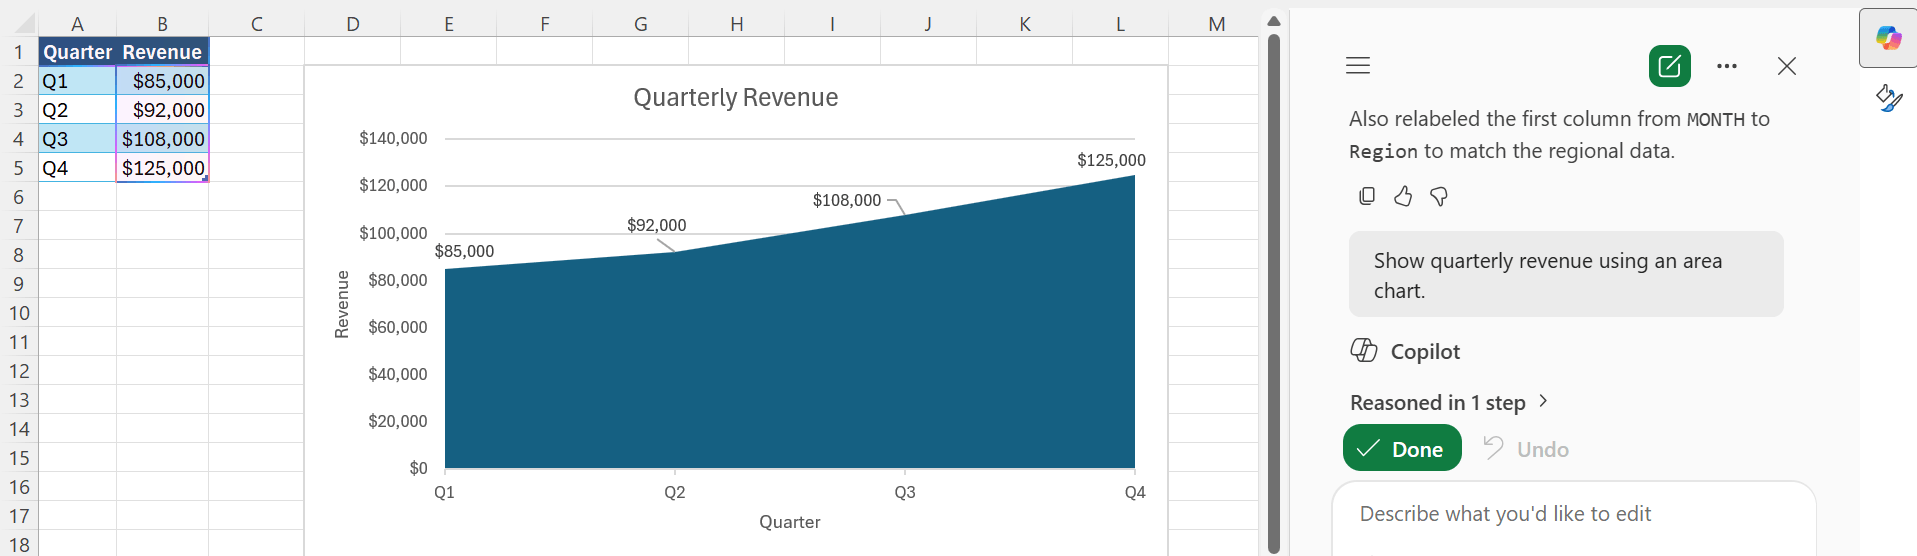
Area Charts
“Show quarterly revenue using an area chart.”
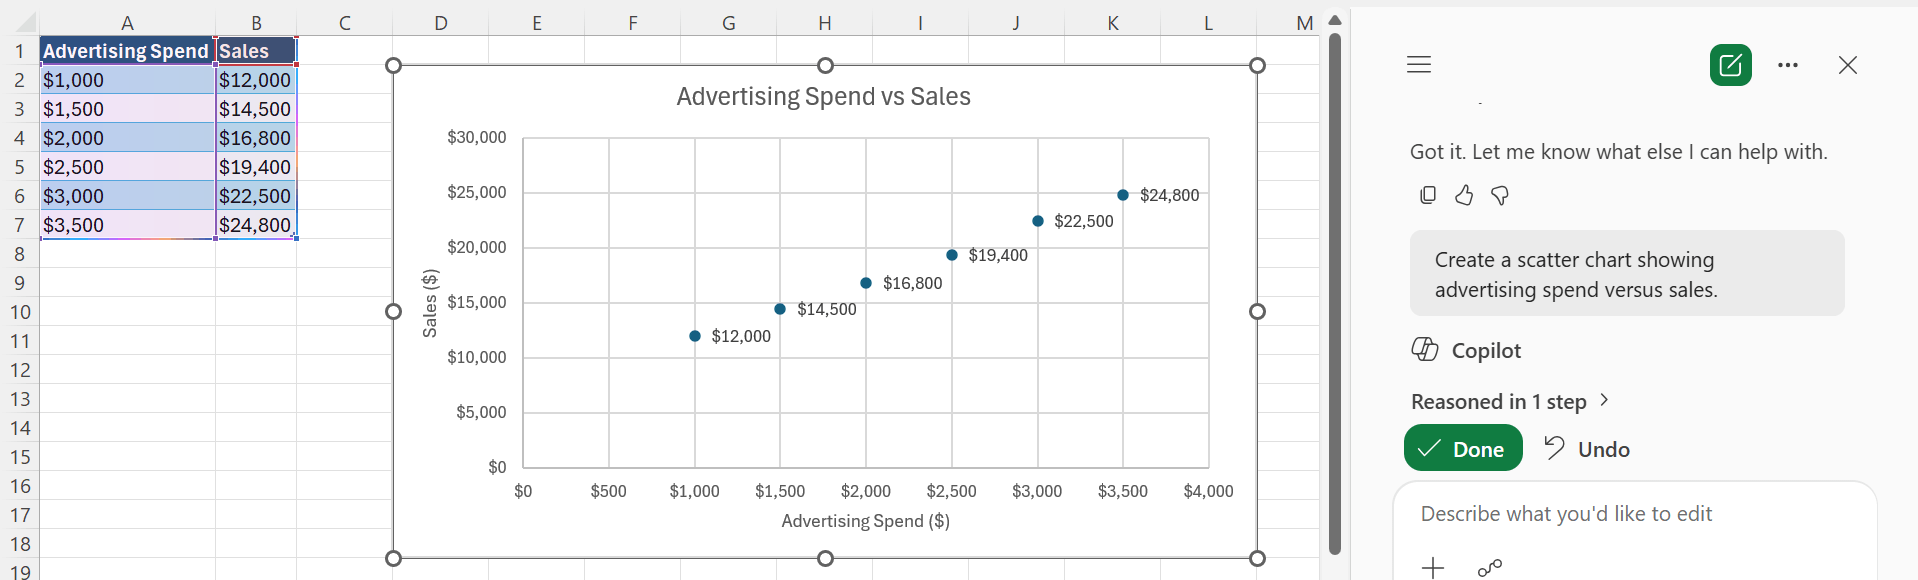
Scatter Charts
“Create a scatter chart showing advertising spend versus sales.”
Tips & Tricks
- Use clear and descriptive column headers.
- Remove blank rows and columns from the dataset.
- Make sure numbers are stored as numbers, not text.
- Be specific when describing the chart you want.
- Review the generated chart before inserting it.
- Ask Copilot to modify the chart if needed.
- Choose the chart type that best matches your data.
FAQs
1. How to Create Charts with Copilot in Excel?
Copilot can generate charts based on your text prompt. Simply describe the chart you want, and Copilot will analyze the data and create it.
2. Do I need a Microsoft 365 subscription to use Copilot?
Yes, Copilot requires a Microsoft 365 subscription that includes Copilot access. You must also use a supported version of Excel and save your workbook to OneDrive or SharePoint to access Copilot features.
3. What types of charts can Copilot create?
Copilot can create column, bar, line, pie, area, and scatter charts.
4. Does my data need to be in a table?
Yes, Copilot works best when your data is formatted as a table with headers.
5. What is Copilot in Excel?
Copilot in Excel is an AI-powered assistant that helps automate data analysis, generate insights, and simplify tasks like formula creation. It uses natural language queries, allowing users to interact with data easily.

John Michaloudis is a former accountant and finance analyst at General Electric, a Microsoft MVP since 2020, an Amazon #1 bestselling author of 4 Microsoft Excel books and teacher of Microsoft Excel & Office over at his flagship MyExcelOnline Academy Online Course.


