Duplicate data in Microsoft Excel can disrupt your data analysis and cause inaccuracies and confusion. Excel offers great tools to manage and count duplicates to keep the data clean. In this article, you will learn how to count duplicates in Excel.
Key Takeaways:
- Excel has built-in tools to find and manage duplicate data.
- The COUNTIF function helps count how many times a value appears.
- COUNTIFS can count duplicates using multiple conditions at once.
- The UNIQUE function and filters make it easy to find unique values.
- Remove Duplicates and Power Query help clean large datasets efficiently.
Table of Contents
Introduction to Counting Duplicates in Excel
Duplicate data in Excel can create roadblocks in your data analysis. Whether you’re working with a customer mailing list or tracking inventory, it is important to recognize that duplicates and remove them. With Excel’s powerful toolkit, you can spot those duplicate values swiftly and keep your data clean and reliable.
You can choose from options like simple sorting. conditional formatting, COUNTIF, and Power Query to manage duplicate data.
Let these tools take the drudgery out of duplicate management, as they help you not only identify but also manipulate and analyze your data with greater precision.
How to Manage and Count Duplicates
COUNTIF Function
The COUNTIF function can easily count how many times a specific value appears in a range.
=COUNTIF(range, criteria).
Let’s have a look at the steps to count duplicates in Excel using COUNTIF;
STEP 1: Choose the column where you want to identify duplicates.

STEP 2: In an adjacent column, write the COUNTIF formula.

STEP 3: Drag the formula down the column to apply it to each cell in the selected range. Each cell now shows the count of duplicates for the corresponding entry.

STEP 4: Entries with a count greater than 1 indicate duplicates.

Duplicates with COUNTIFS
You can use the COUNTIFS function to count duplicates based on multiple criteria.
STEP 1: Set the criteria based on which you want to count duplicates.

STEP 2: In an adjacent column, use the COUNTIFS formula.

STEP 3: Drag the formula down to apply it to all rows.

Review the counts to identify duplicate rows.

Advanced Techniques
Filters
Filters in Excel aren’t just for sorting; they can be a powerful ally in uncovering unique insights from your dataset. By selecting the filter option from the Data tab, you can quickly isolate distinct values.
STEP 1: Highlight the column containing the data with duplicates.

STEP 2: Go to the Data tab.

STEP 3: Under the “Sort & Filter” group, select “Advanced.”

STEP 4: In the “Advanced Filter” dialog box, choose “Copy to another location” and check “Unique records only.”
Select the range where you want the unique values to appear. Click OK.

STEP 5: Excel filters and displays only the unique values in the specified range.

Power Query
With Power Query, Excel transforms into an even more potent tool for handling duplicates. You can connect to various data sources, cleanse, and reshape the information precisely how you need it. When it comes to duplicates, Power Query walks you through a series of steps that allow you to remove them effortlessly. It provides you with a dynamic and updatable solution.
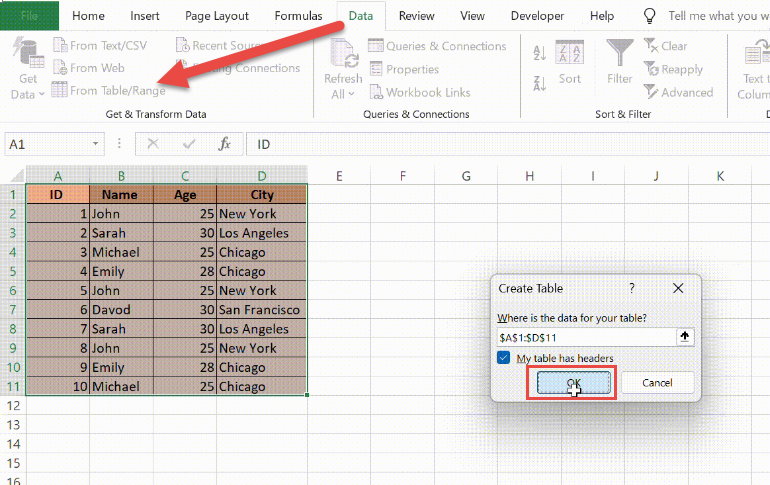
STEP 1: Select your dataset and go to the “Data” tab.

STEP 2: Click “From Table/Range” to import your data into Power Query Editor.
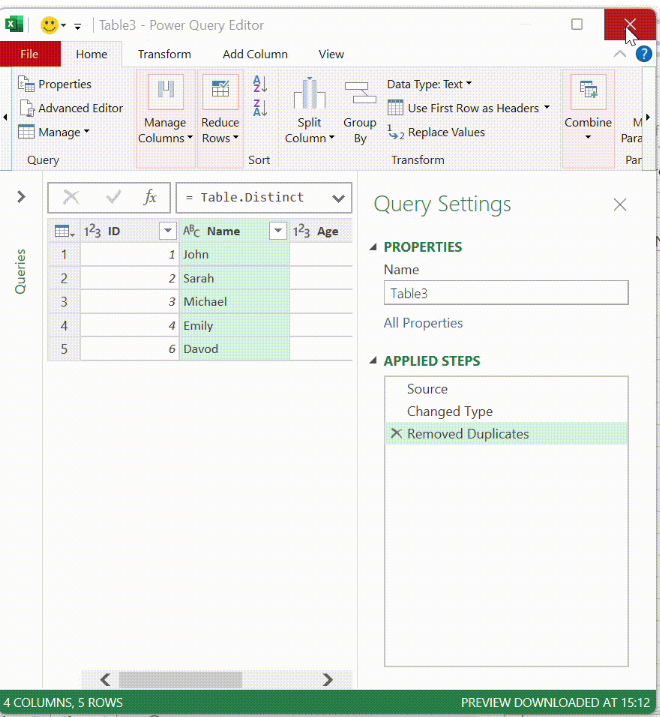
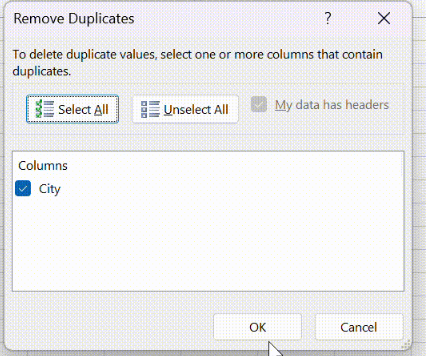
STEP 3: In Power Query Editor, select the columns you want to scan for duplicates.

STEP 4: Now go to the “Home” tab and click “Remove Duplicates.”

STEP 5: Click “OK” to remove duplicates.
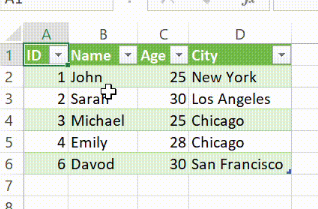
Finally, load the cleaned data back into Excel by clicking “Close & Load.”
Remove Duplicates
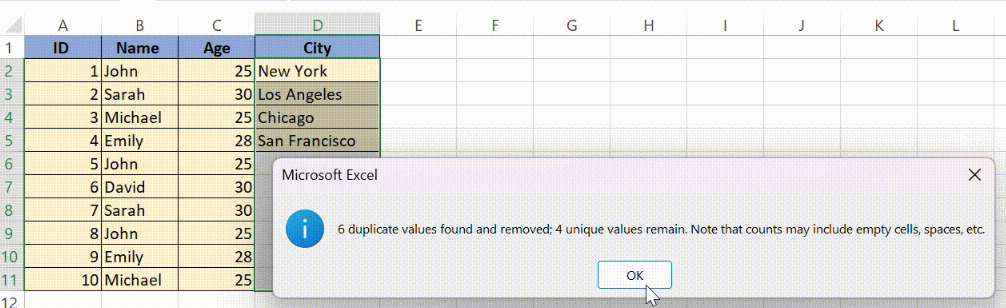
STEP 1: Check the columns you want Excel to scan for duplicates

STEP 2: Go to the Data tab > Data Tools > Remove Duplicates.

STEP 3: Click OK.
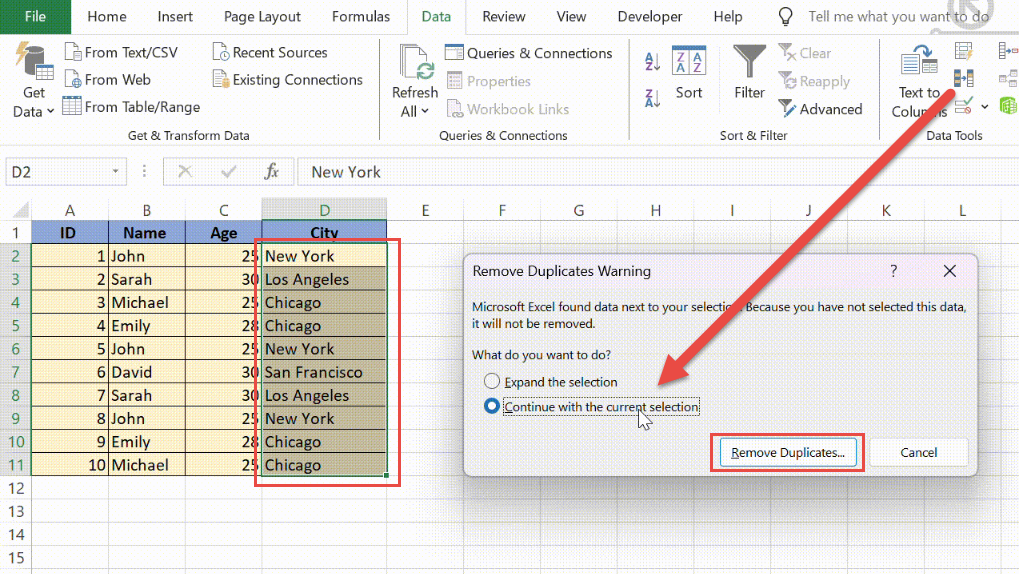
Excel removes the duplicate rows.
FAQs
What’s the most efficient way to find and remove duplicates in large datasets?
The most efficient way to find and remove duplicates in large datasets is by using the ‘Remove Duplicates’ feature under the Data tab.
Is there a way to count duplicates in Excel?
Yes, you can count duplicates in Excel using the COUNTIF function. Apply the COUNTIF formula to return the count of how many times a specific value appears within that range.
=COUNTIF(range, value)
How to count matching cells in Excel?
To count matching cells in Excel, use the COUNTIF function. The formula =COUNTIF(range, "criteria") helps you tally up cells that meet a certain criterion. For example, to count cells that exactly match “Apple”, use =COUNTIF(A1:A10, "Apple").
How to highlight duplicates in excel?
To highlight duplicates in Excel, use Conditional Formatting.
- Select the cells you wish to check
- Go to the ‘Home’ tab
- Click ‘Conditional Formatting‘
- Select ‘Highlight Cells Rules’
- Choose ‘Duplicate Values.
- Pick your desired formatting style
- Click ‘OK’

John Michaloudis is a former accountant and finance analyst at General Electric, a Microsoft MVP since 2020, an Amazon #1 bestselling author of 4 Microsoft Excel books and teacher of Microsoft Excel & Office over at his flagship MyExcelOnline Academy Online Course.


