Free Practice Workbook
Excel dashboards are very useful in turning a large dataset into a simple visual report. Instead of manually editing data, adding charts or summaries, you can use Copilot to analyse the data and build a dashboard. In this article, you will learn how to create an Excel dashboard with Copilot.
Key Takeaways:
- Copilot can help analyze data and create an Excel dashboard.
- An Excel dashboard can include KPIs, charts, tables, and summaries.
- You can use specific Copilot prompts to create different dashboard elements.
- Always review Copilot’s formulas, calculations, and summaries before using them.
- Keep the dashboard simple and focus on the most important information
Table of Contents
What is an Excel Dashboard?
An Excel dashboard is a visual report that displays important information in one place. It can include charts, tables, KPIs, and other summaries. It is especially useful when you need to present data to someone who does not want to go through a large worksheet. It brings the most important numbers and trends together so they can be reviewed quickly.
For example, a sales dashboard can show:
- Total Sales
- Total Profit
- Number of Orders
- Sales by Region
- Sales by Product
- Monthly Sales Trend
- Target vs. Actual Sales
A dashboard makes it easier to understand the data without going through every row in the worksheet.
How to Create an Excel Dashboard with Copilot
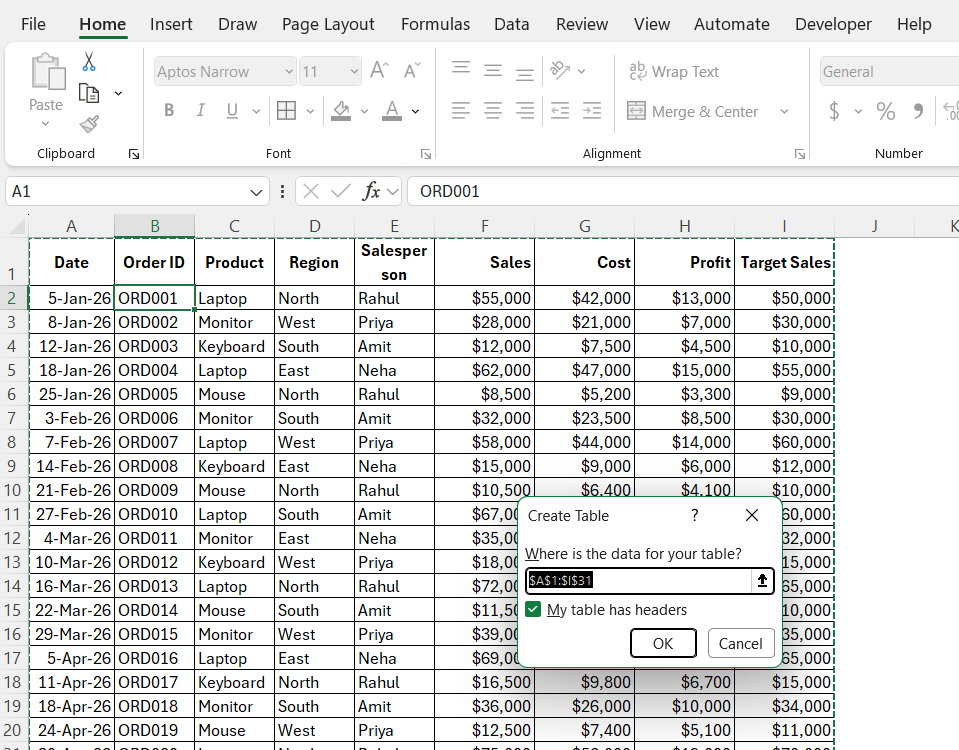
STEP 1: Select a cell inside your dataset.
STEP 2: Press Ctrl + T to create a table. Click OK.
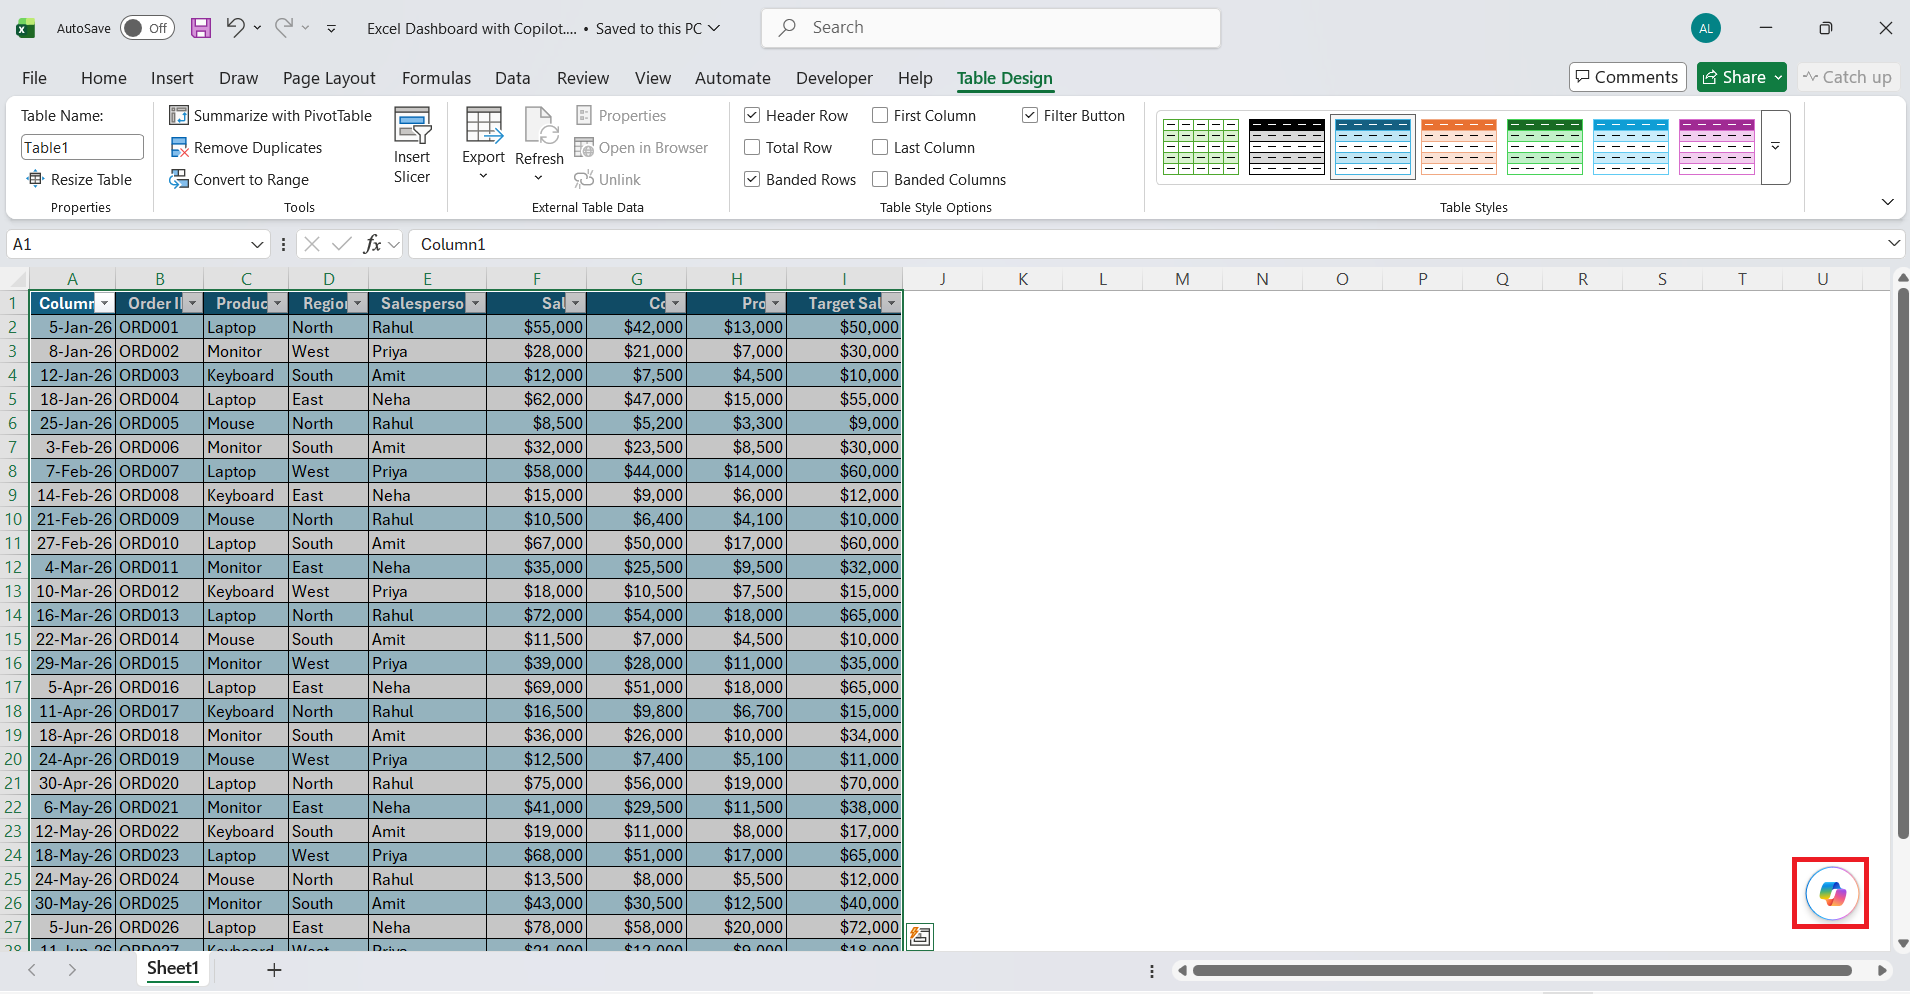
STEP 3: Click on the Copilot button.
STEP 4: Type this prompt to create a dashboard:
Analyze this sales data and identify the most important KPIs, trends, and comparisons that should be included in a sales dashboard.
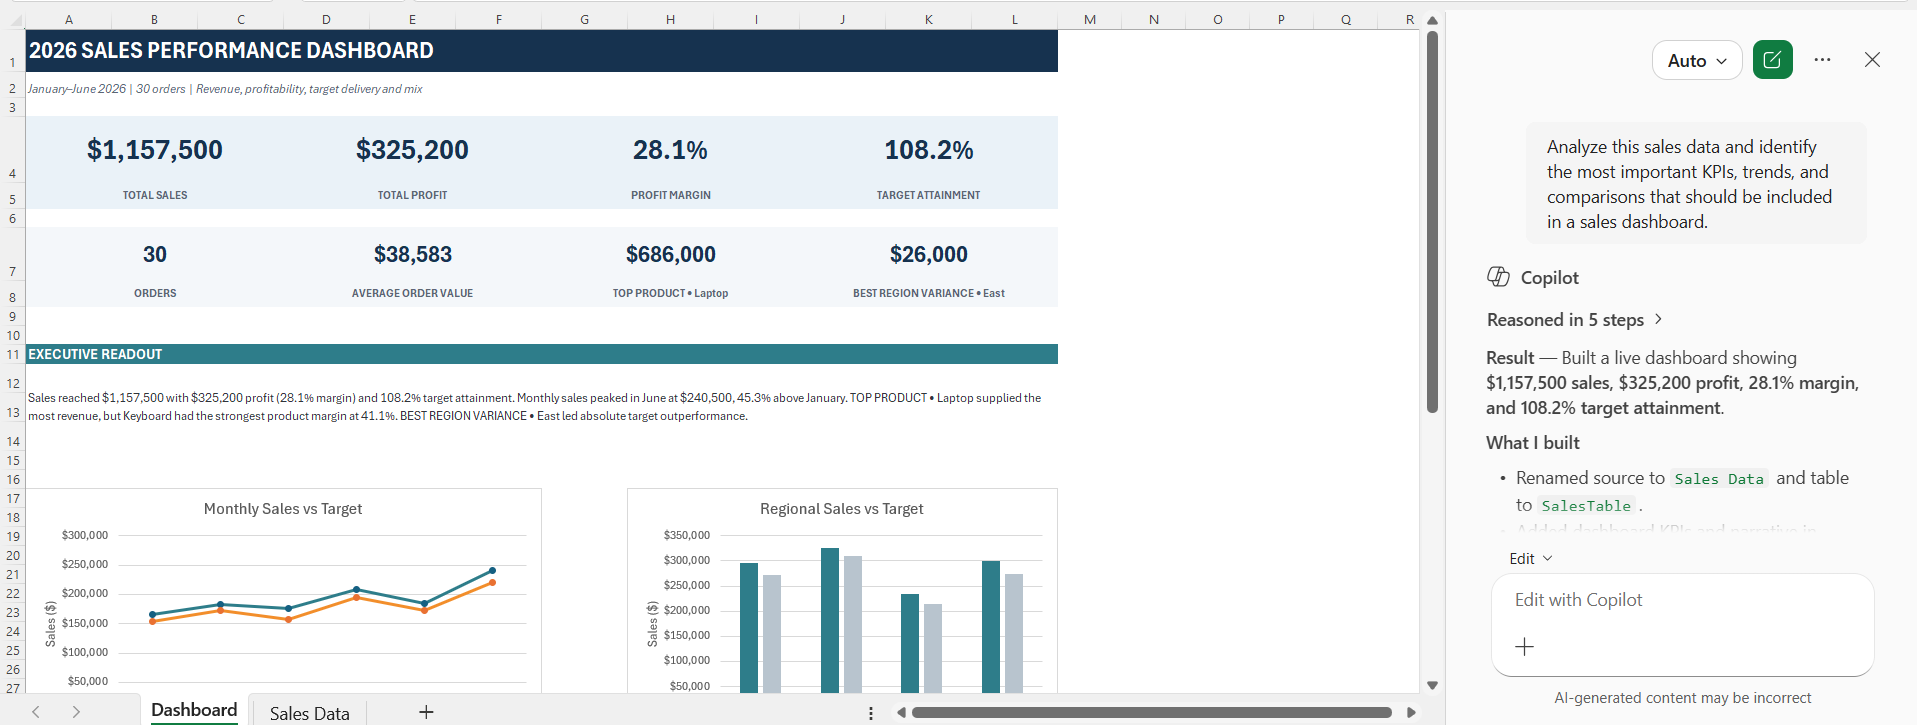
Instead of directly creating the dashboard, you can also add different metrics by using separate prompts.
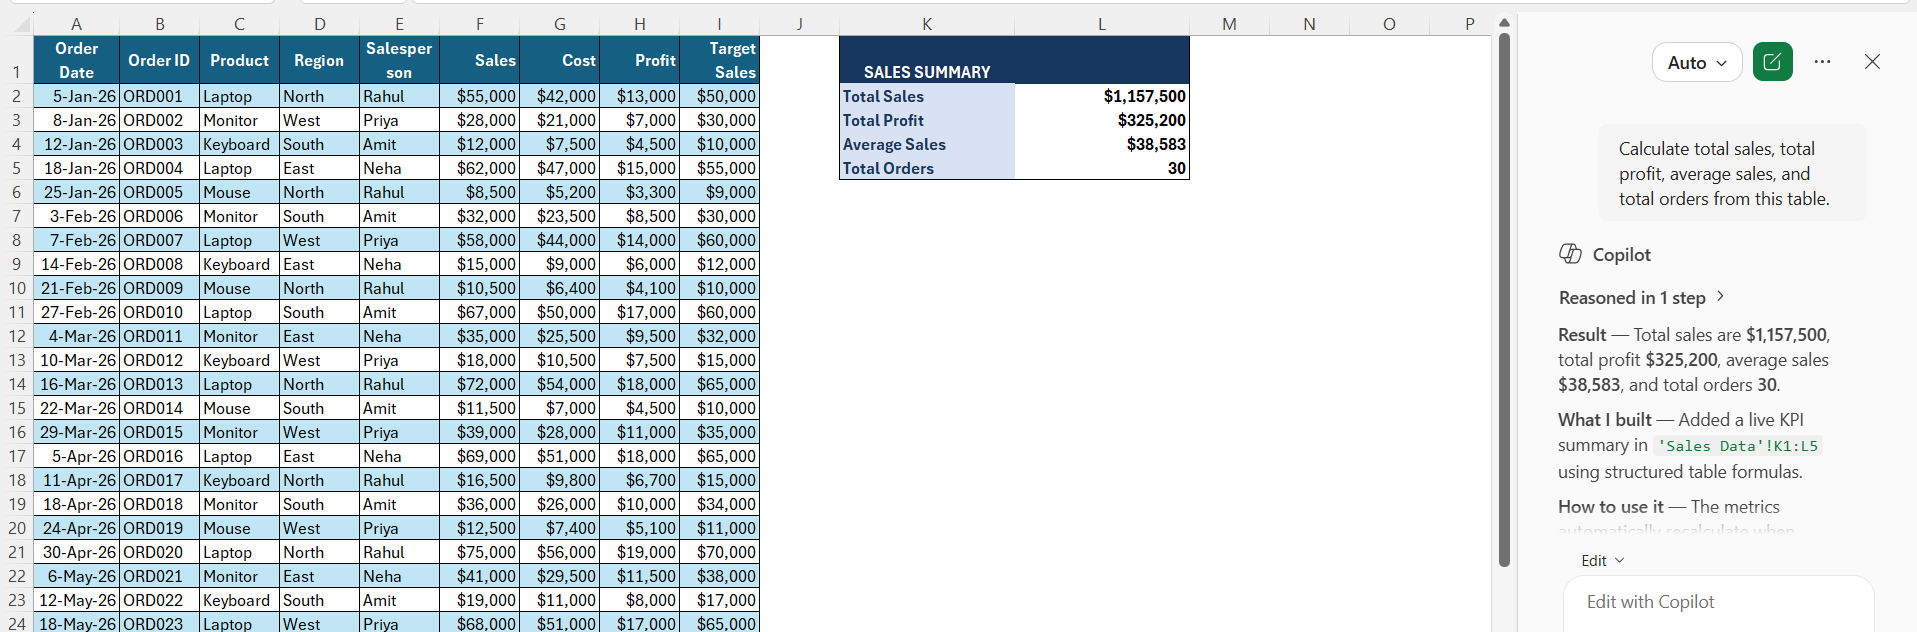
STEP 5: Type this prompt to show key KPIs:
Calculate total sales, total profit, average sales, and total orders from this table.
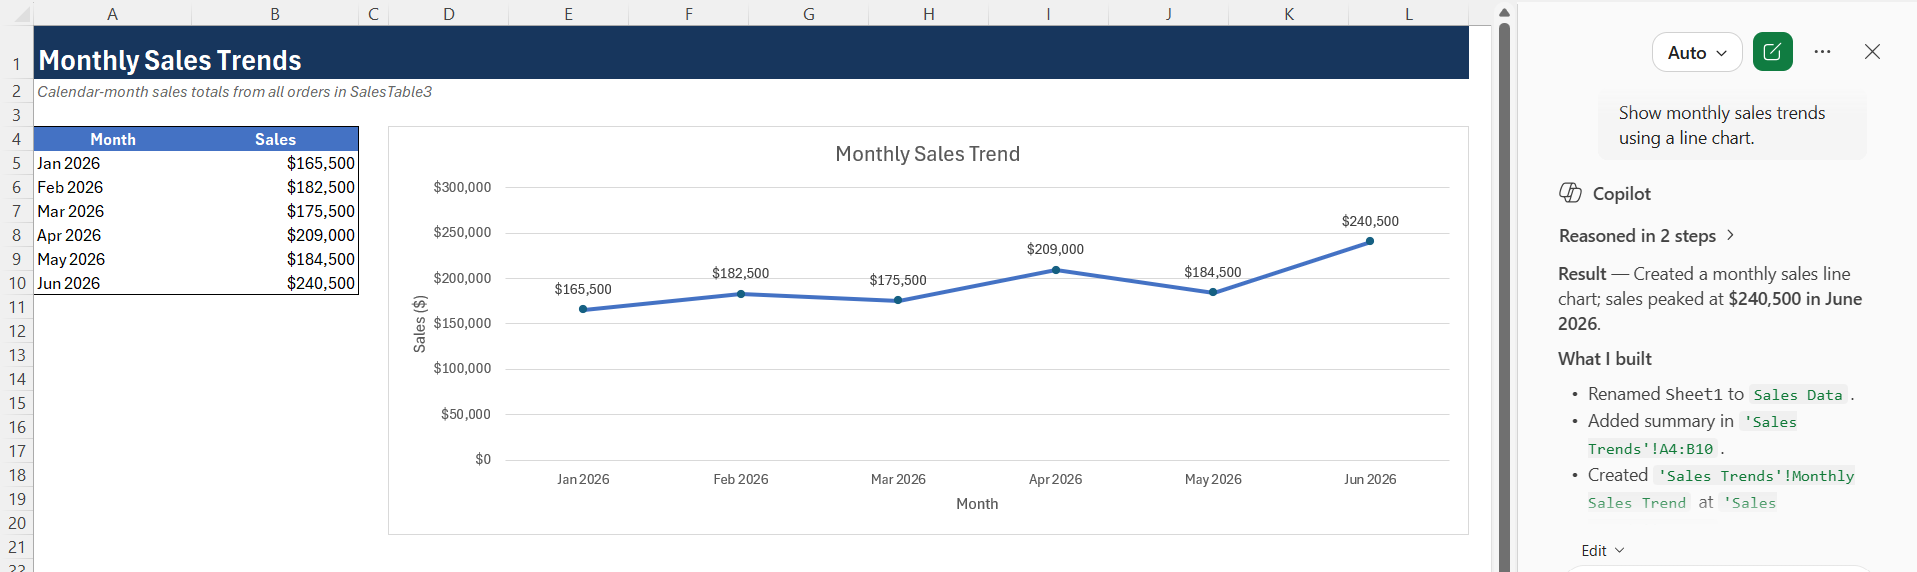
STEP 6: Type this prompt to show sales trend:
Show monthly sales trends using a line chart.
STEP 7: Type this prompt to compare sales across different regions and products.
Create charts to show total sales by region and by product.
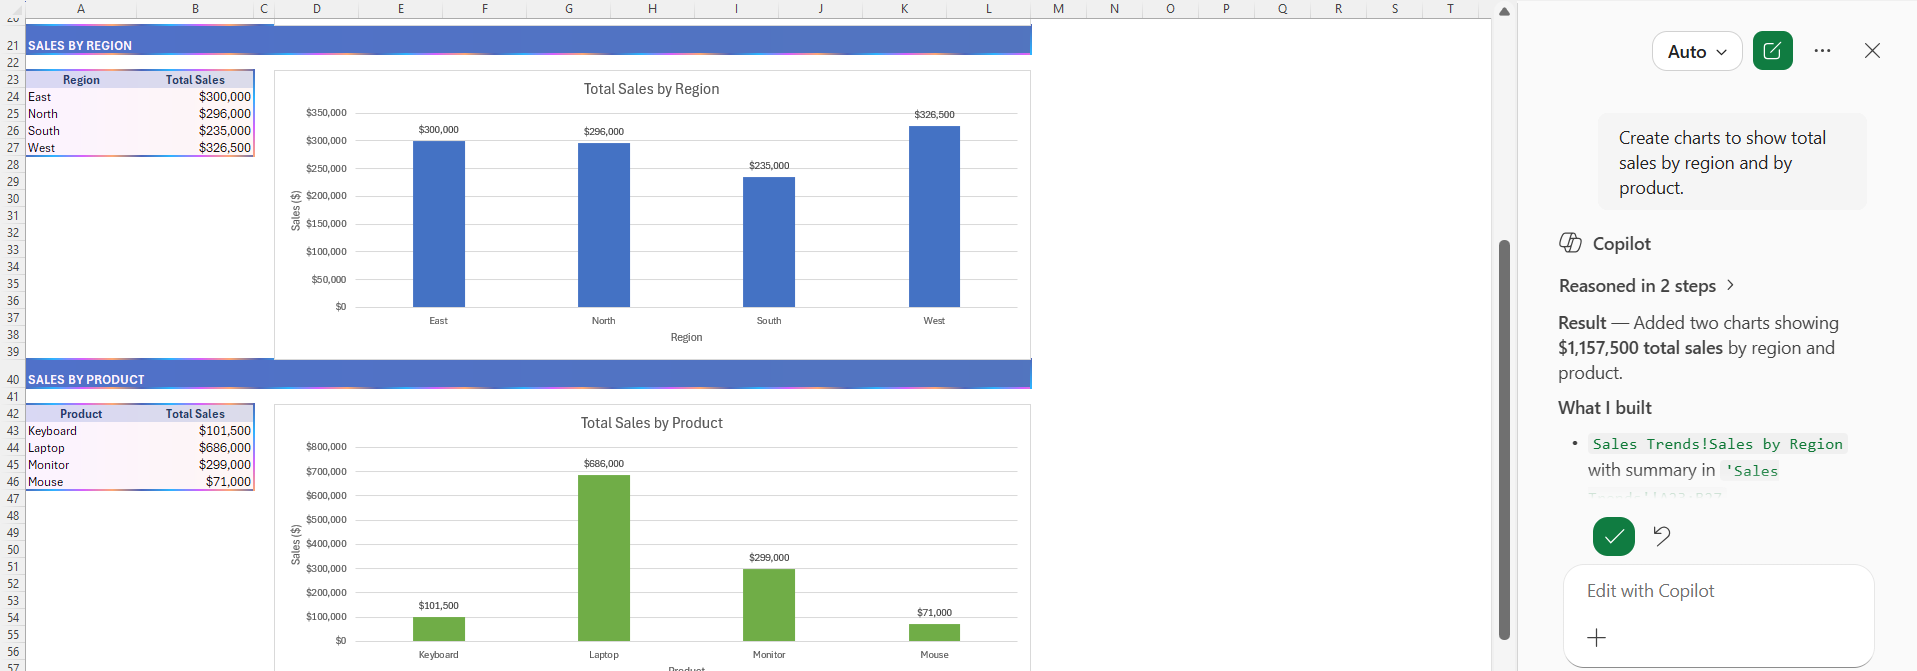
You can continue using Copilot to add other useful comparisons, such as actual sales versus target sales or profit by product. This allows you to build the dashboard according to the information you need instead of adding charts that are not useful.
Tips & Tricks
- Instead of asking Copilot to create a dashboard, provide specific prompts and build the dashboard elements separately.
- Make sure to review the formula and summaries before using them in a report.
- Keep the dashboard simple. A few useful KPIs are much better than a dashboard filled with unnecessary visuals.
- It is important to ask Copilot for insights after creating the charts.
- You should use clear headings so that Copilot understands what each column represents.
- Arrange the most important KPIs at the top of the dashboard so they can be viewed quickly.
FAQs
1. Can Copilot create an Excel dashboard?
Yes, Copilot can be used to analyze data, create KPIs, and generate charts for an Excel dashboard.
2. How to prepare my data for Copilot?
Before asking Copilot to build a dashboard, you should:
- Select your dataset
- Press Ctrl + T to convert it into an Excel Table
- Make sure the table has clear column headers
- Click OK
3. Can Copilot create charts for an Excel dashboard?
Yes. You can ask Copilot to create charts such as monthly sales trends, sales by region, or sales by product.
4. What prompts can I use to create a dashboard with Copilot?
You can ask Copilot to calculate KPIs, identify patterns, create charts, compare values, or analyze insights from your data.
5. Should I check the results generated by Copilot?
Yes. Make sure to review the formulas and calculations done by Copilot before using them in the dashboard.

John Michaloudis is a former accountant and finance analyst at General Electric, a Microsoft MVP since 2020, an Amazon #1 bestselling author of 4 Microsoft Excel books and teacher of Microsoft Excel & Office over at his flagship MyExcelOnline Academy Online Course.

 30 Days - Full Access