Free Practice Workbook
You can end up spending hours writing complex formulas, building reports, or identifying outliers in Excel. With the help of Microsoft Copilot, you can perform these analyses using simple, natural-language prompts. In this article, you will learn how to find trends, outliers, and insights with Copilot in Excel.
Key Takeaways:
- Copilot can spot trends in Excel data.
- You can use Copilot to find unusual values and outliers.
- Copilot can summarize important insights from your data.
- Copilot can create charts to visualize trends and patterns.
- Clear and organized data helps Copilot provide better results.
Table of Contents
Why Analyze Data with Copilot?
When working with large datasets, it may be difficult to extract meaningful information from them. Copilot can help you by:
- Finding trends over time
- Spotting unusual values or outliers
- Summarizing key insights
- Creating visualizations and charts
- Finding any missing patterns
Using Copilot to Spot Trends
STEP 1: Go to the Home tab.

STEP 2: Select the Copilot button.

STEP 3: In the Copilot pane, type the prompt:
“Analyze this dataset and spot trends.”
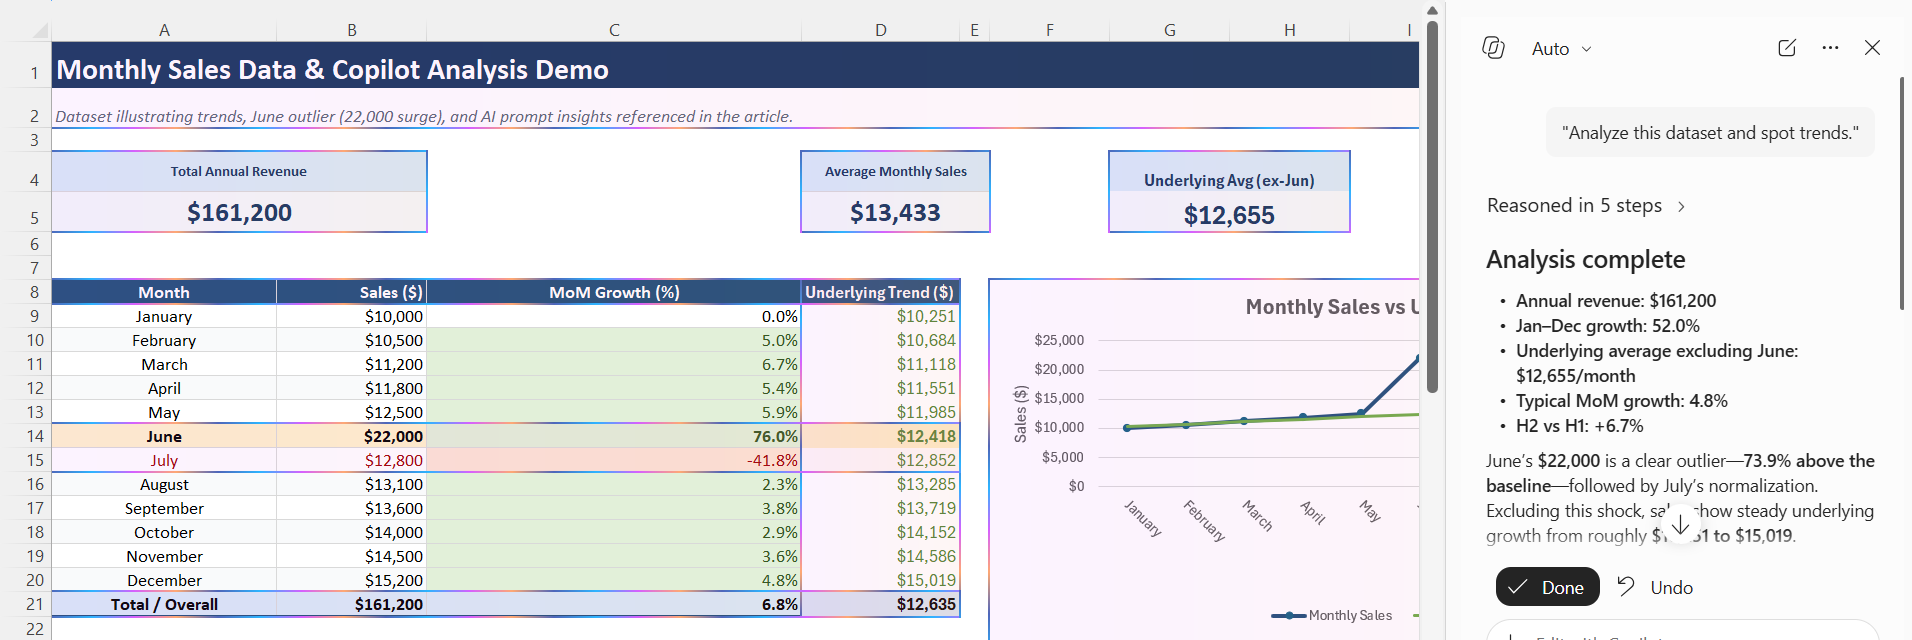
You can also use prompts such as:
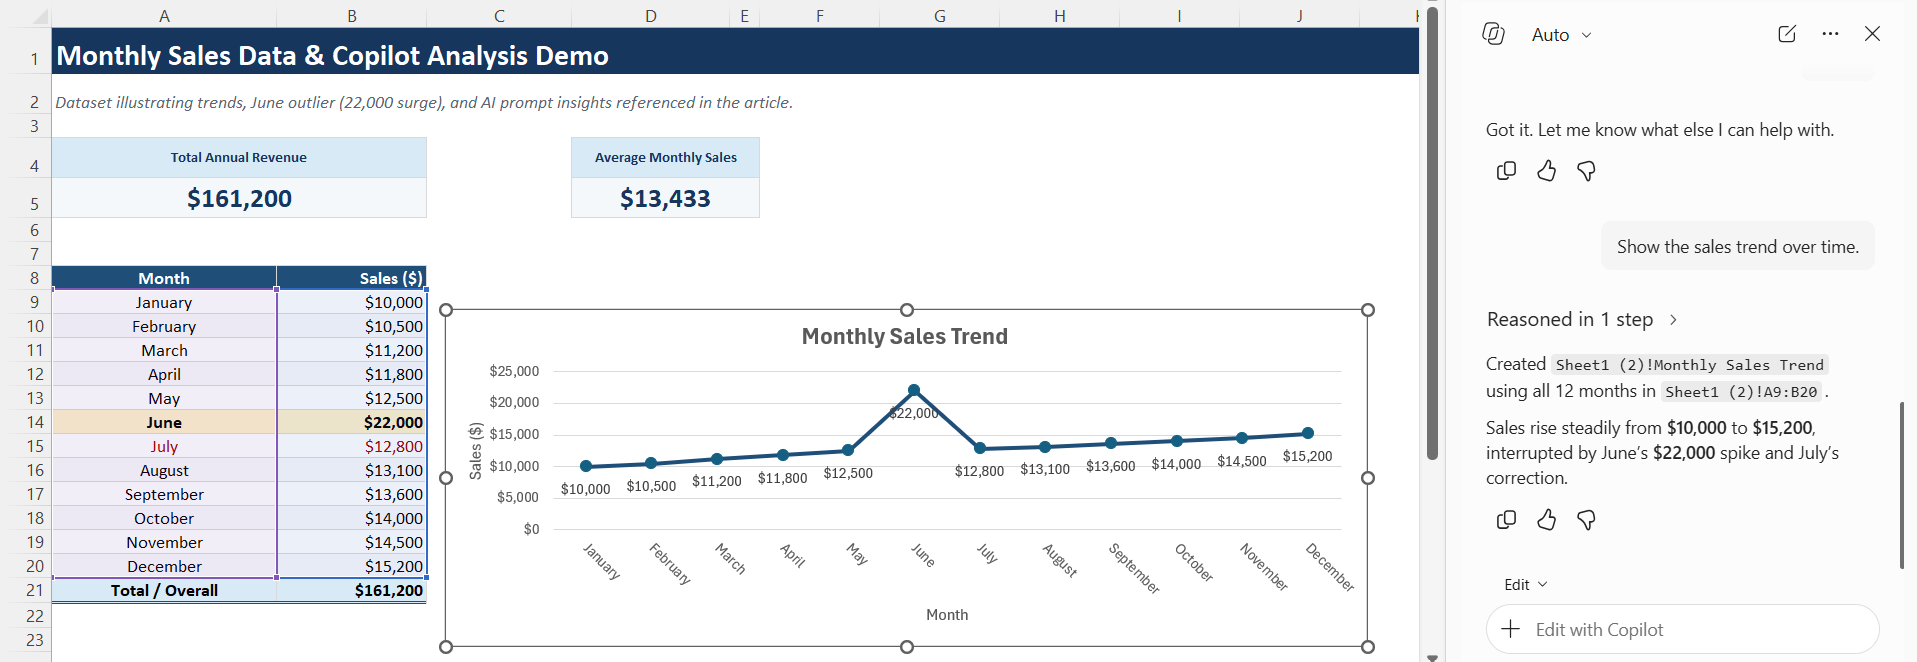
- Show the sales trend over time.
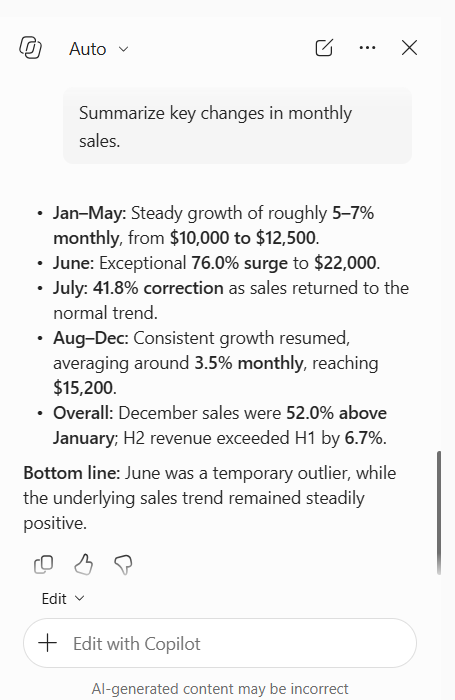
- Summarize key changes in monthly sales.
Finding Outliers with Copilot
Outliers are values that stand out from the rest of the dataset. They can affect reports and business decisions, and you can use Copilot to quickly find outliers.
The prompt that can be used is:
“Find any outliers in this sales data.”
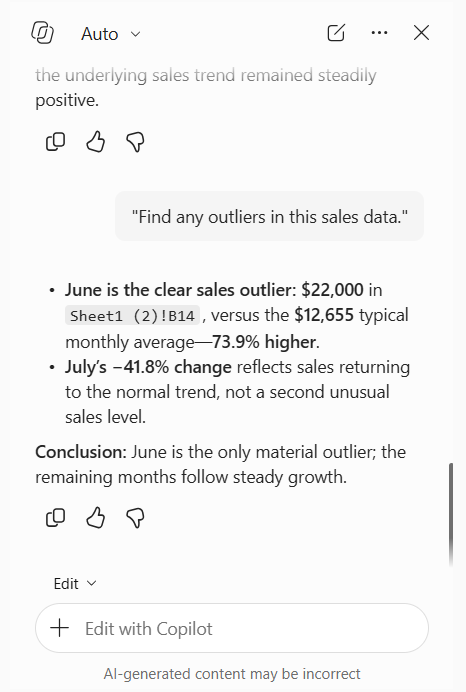
Copilot may identify June’s sales value of 22,000 as unusual because it is significantly higher than surrounding months.
Other useful prompts include:
- Show data points that differ significantly from the average.
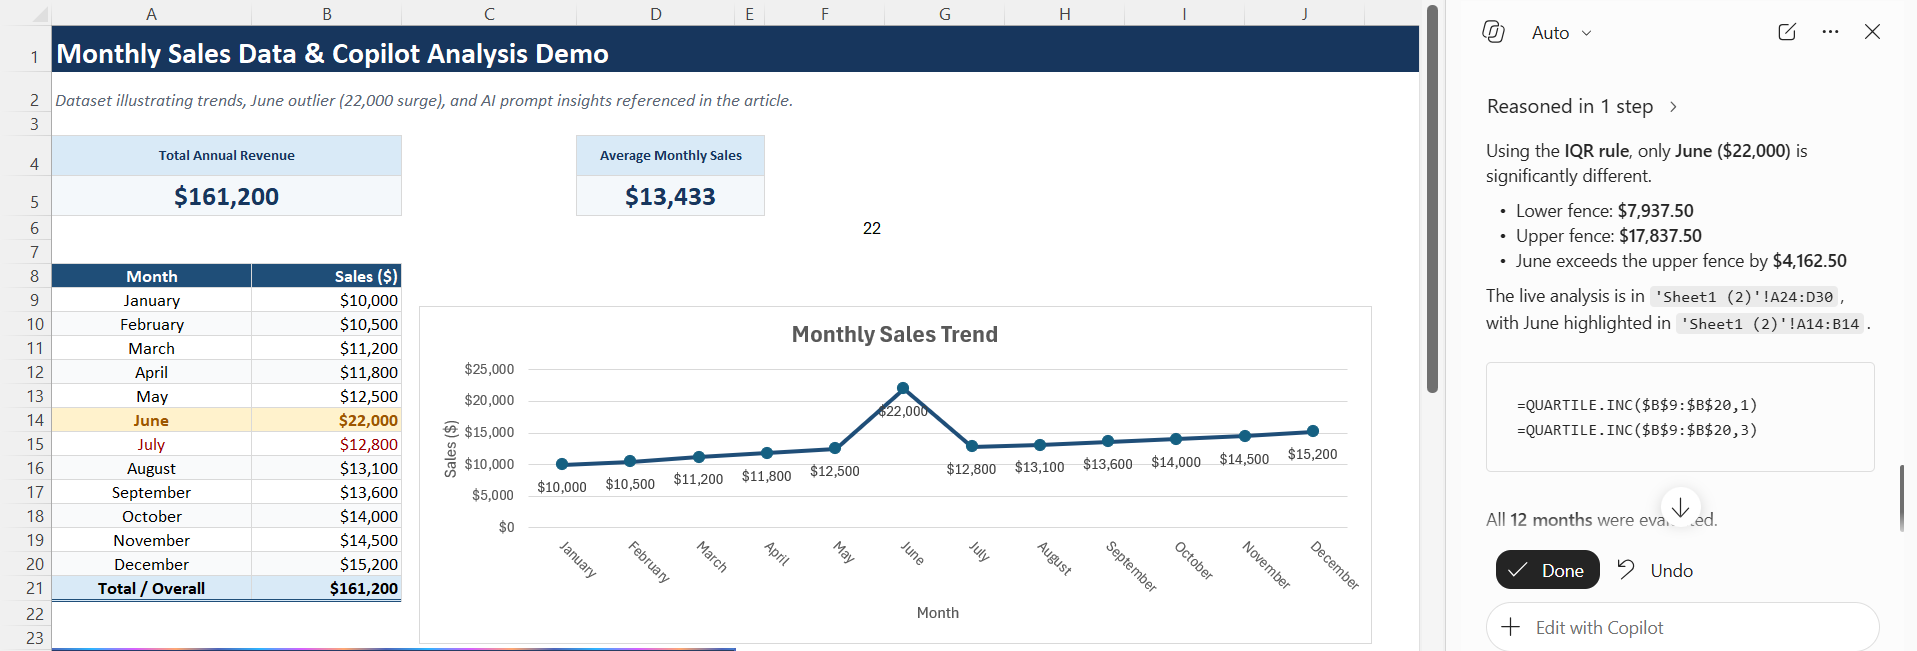
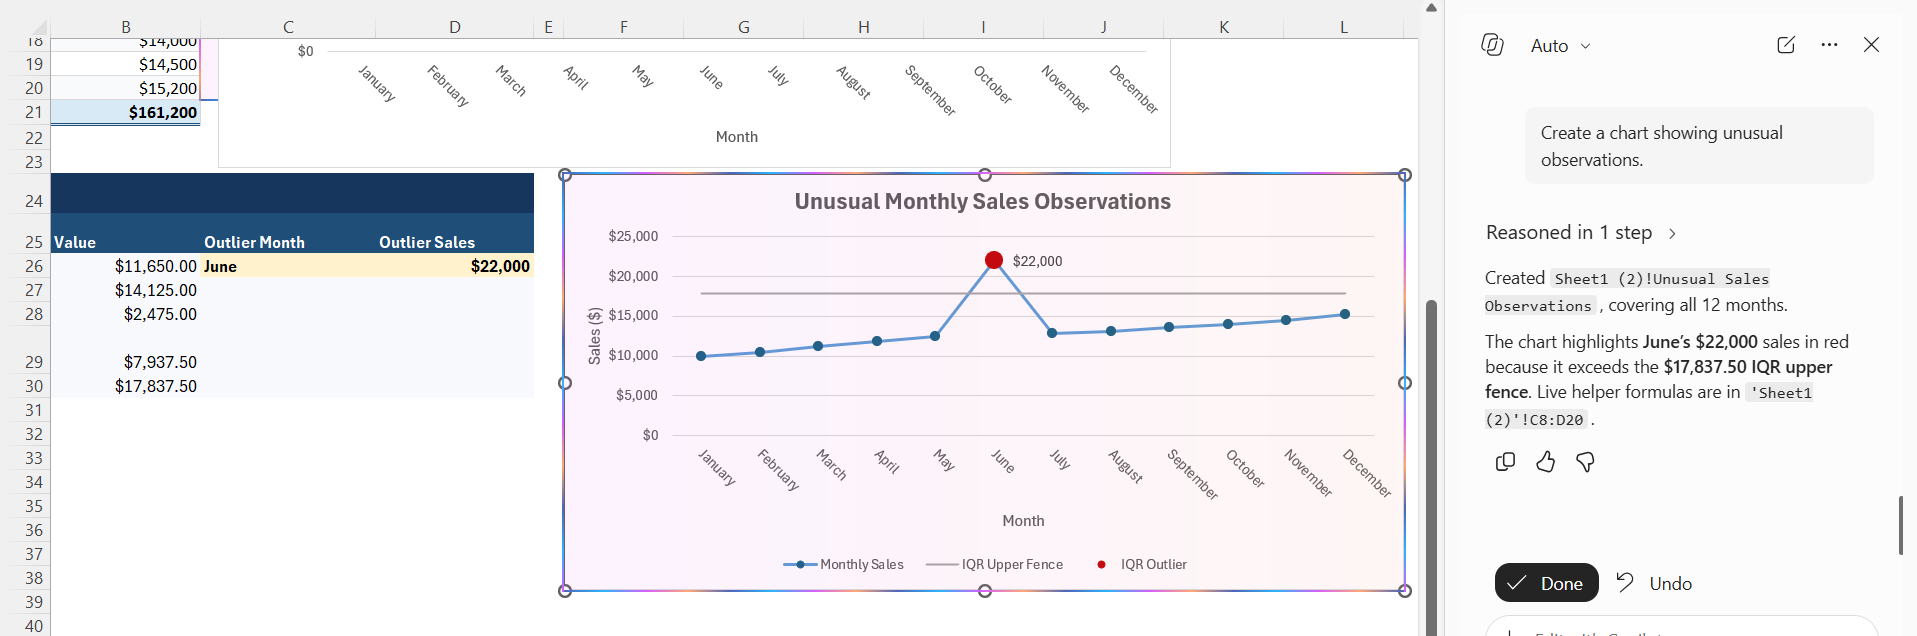
- Create a chart showing unusual observations.
Finding Insights with Copilot
Beyond trends and outliers, Copilot could also be used to extract insights from your data.
Prompt:
“Provide key insights from this dataset.”
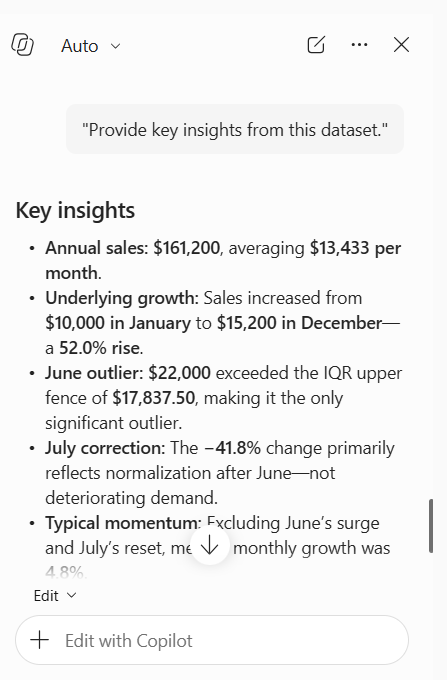
These insights help users focus on what matters most without manually reviewing every row of data.
Using Copilot to Identify Seasonal Patterns
Many datasets contain recurring patterns that repeat over weeks, months, or quarters. Copilot can help you identify these seasonal trends without manually analyzing the data. You can use this prompt:
“Identify any seasonal patterns in this dataset.”
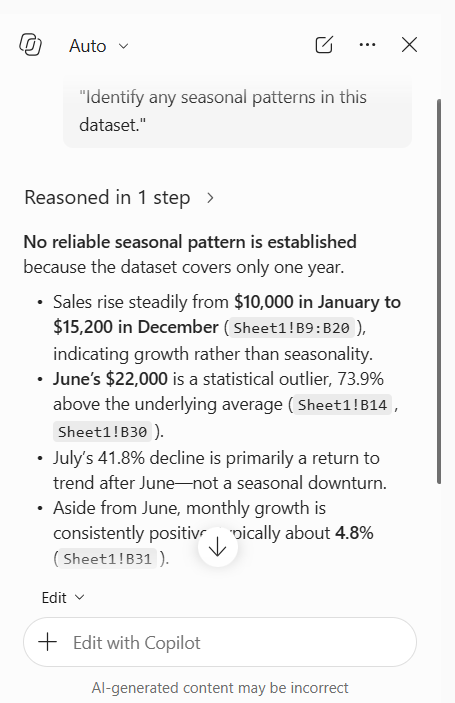
You can also try prompts such as:
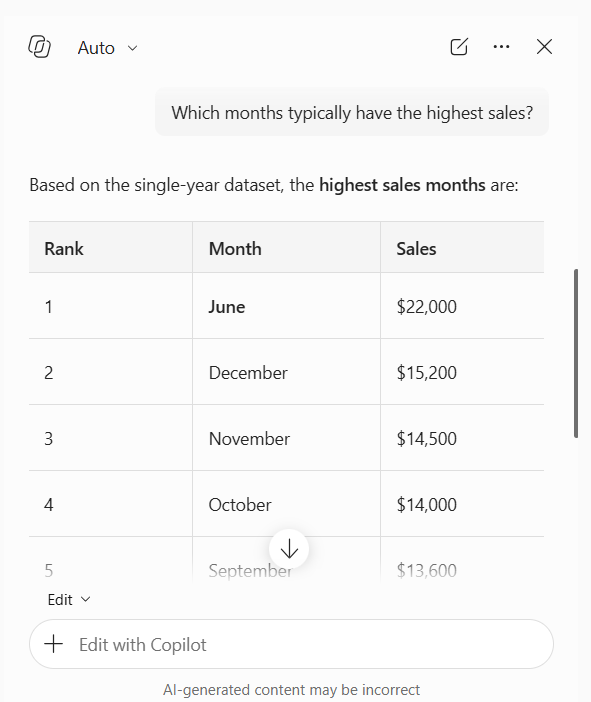
- Which months typically have the highest sales?
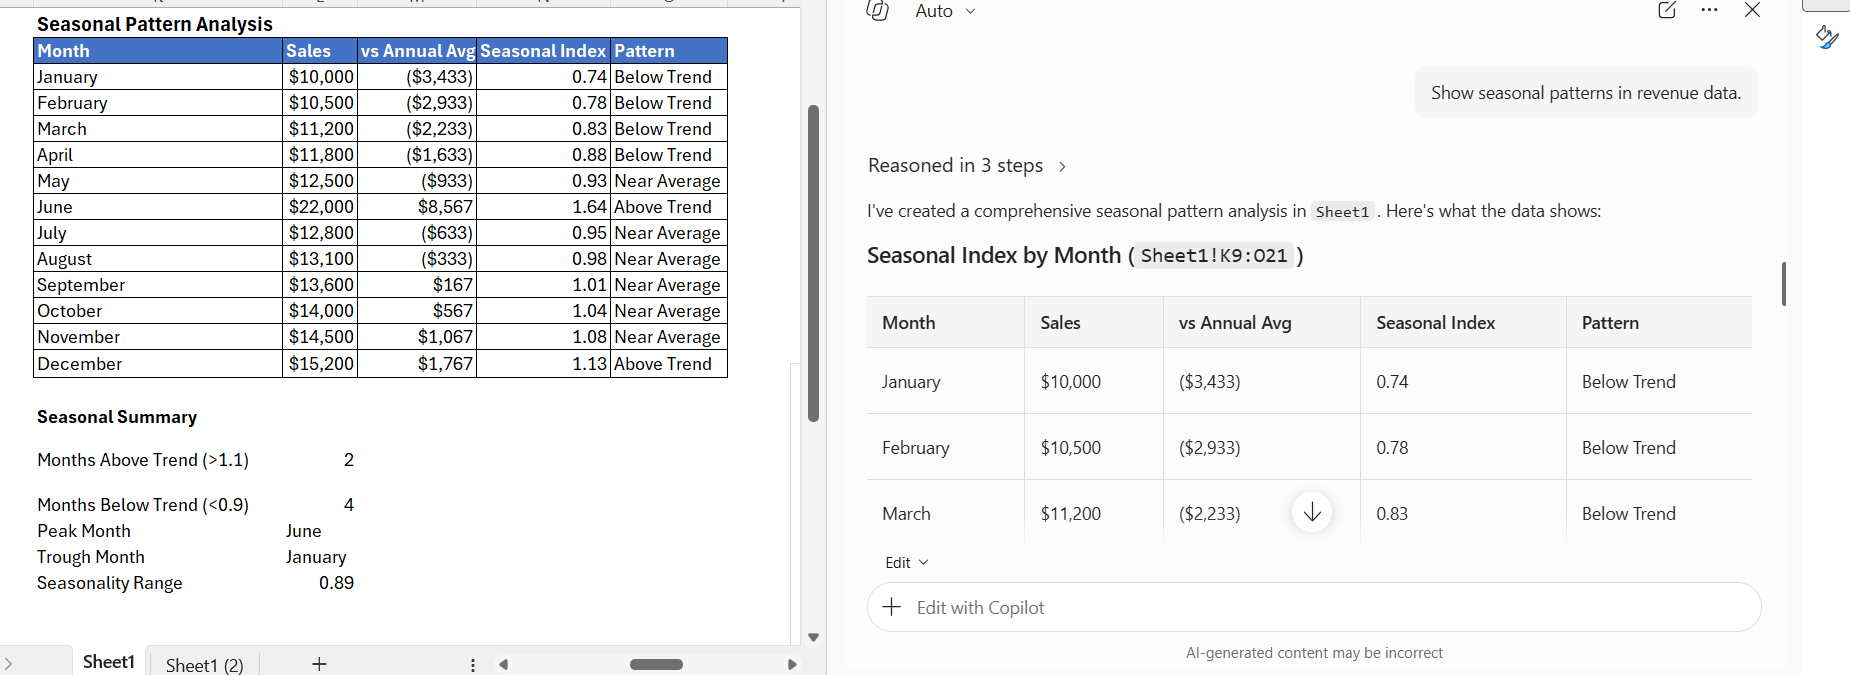
- Show seasonal patterns in revenue data.
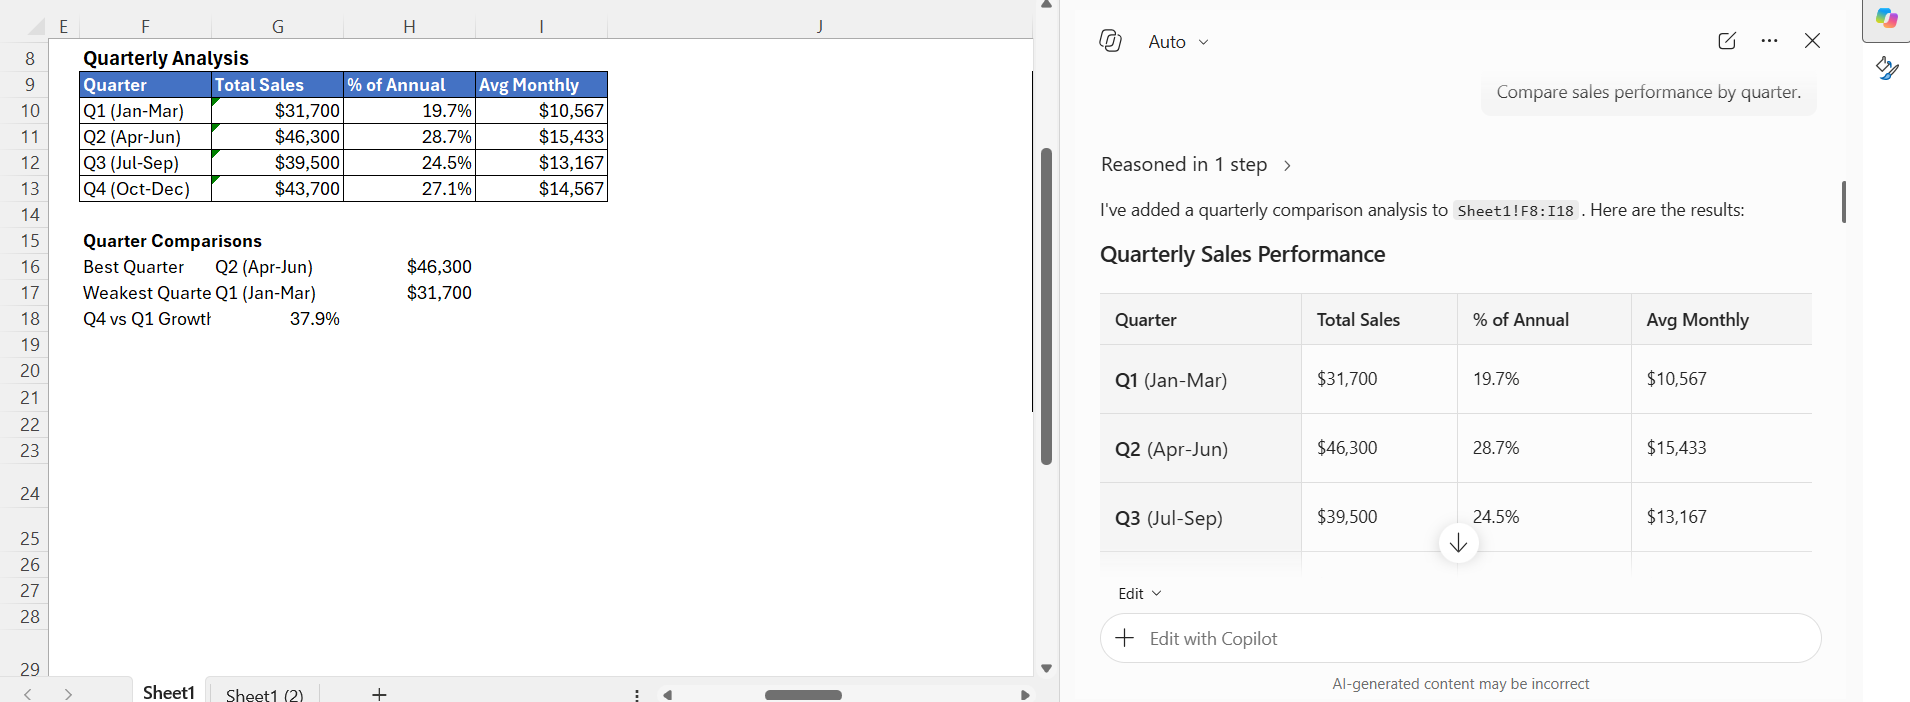
- Compare sales performance by quarter.
- Create a chart highlighting seasonal trends.
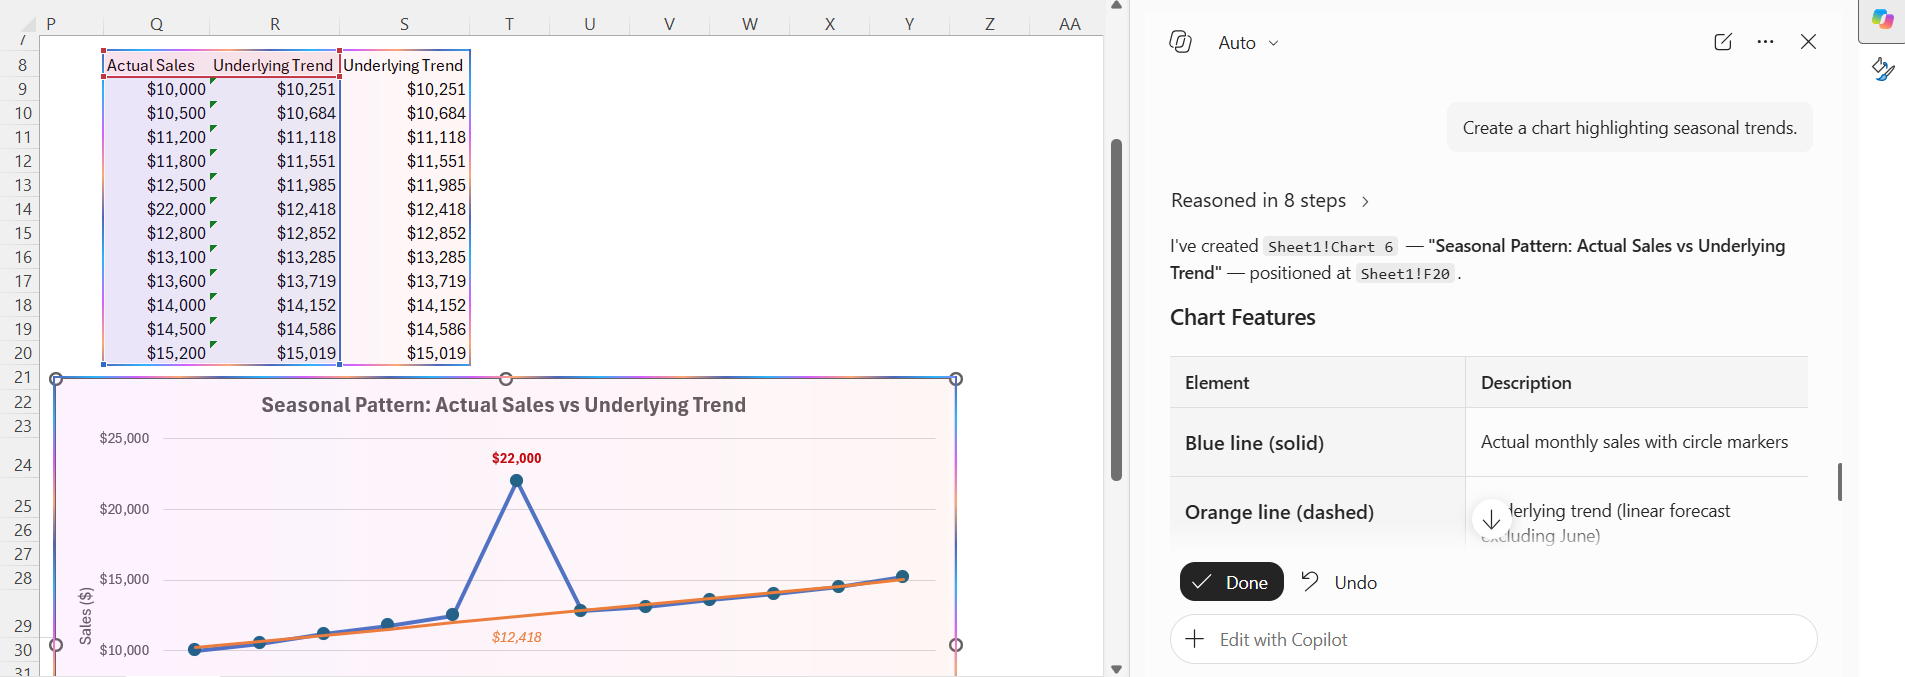
Copilot can analyze historical data and point out periods of consistently high or low performance. For example, it may identify increased sales during holiday seasons or reduced activity during certain months.
Recognizing seasonal patterns helps businesses plan inventory, allocate resources, forecast demand, and make better strategic decisions based on historical performance.
Best Practices
- You should keep data clean and organized before analysis.
- Make sure to use clear column headers.
- Check unusual values to determine whether they are errors or meaningful events.
- Combine charts with Copilot-generated summaries for better understanding.
- Review insights regularly to monitor changes and emerging patterns.
FAQs
Can Copilot find trends in Excel?
Yes. You can ask Copilot to analyze your data and trends over time or across different categories.
Can Copilot find outliers?
Yes. Copilot can find values that are significantly different from other values in your dataset. It is important to spot these outliers as they can affect business decision.
Can Copilot create charts from Excel data?
Yes. You can ask Copilot to create charts that show trends or unusual observations.
Can Copilot summarize Excel data?
Yes. Copilot can provide a summary of Excel data within seconds.
Should I verify insights with Copilot?
Yes. You should review the data and Copilot’s results to confirm that the identified trends, outliers, and insights are accurate

John Michaloudis is a former accountant and finance analyst at General Electric, a Microsoft MVP since 2020, an Amazon #1 bestselling author of 4 Microsoft Excel books and teacher of Microsoft Excel & Office over at his flagship MyExcelOnline Academy Online Course.

 30 Days - Full Access