Free Practice Workbook
When an Excel workbook contains a large set of data, it may be difficult to find important information. You may need to review hundreds of rows and compare values before you can work on the data. You can ask Copilot to summarize your data using simple prompts instead of manually reviewing every row. In this article, you will learn how to summarize Excel data with Copilot using practical examples.
Key Takeaways:
- Copilot can summarize numbers, categories, and text in an Excel workbook.
- You can use simple prompts to find totals, averages, trends, and important insights.
- Copilot can help summarize data by products, regions, vendors, and other categories.
- You can ask follow-up questions to analyze specific parts of your data in more detail.
- Your workbook should be organized properly and saved to OneDrive or SharePoint to use Copilot.
Table of Contents
What is Copilot in Excel?
Copilot is Microsoft’s AI assistant built into Microsoft 365. You can use Copilot to summarise large datasets in Excel by typing simple prompts. It can review the available data and help you understand the information without manually checking each row. You can ask general questions about the entire dataset or request a summary of specific columns and categories.
Three types of summarisation can be done:
- Numbers: totals, averages, counts, highs and lows, and growth over time.
- Categories: sales by region, sales by product, tickets by status, and spend by vendor.
- Text: customer comments and survey answers.
Also, make sure that you have a Microsoft 365 subscription with a Copilot license and that the workbook is saved to OneDrive or SharePoint.
How to Summarize Excel Data with Copilot
Step-by-Step Guide
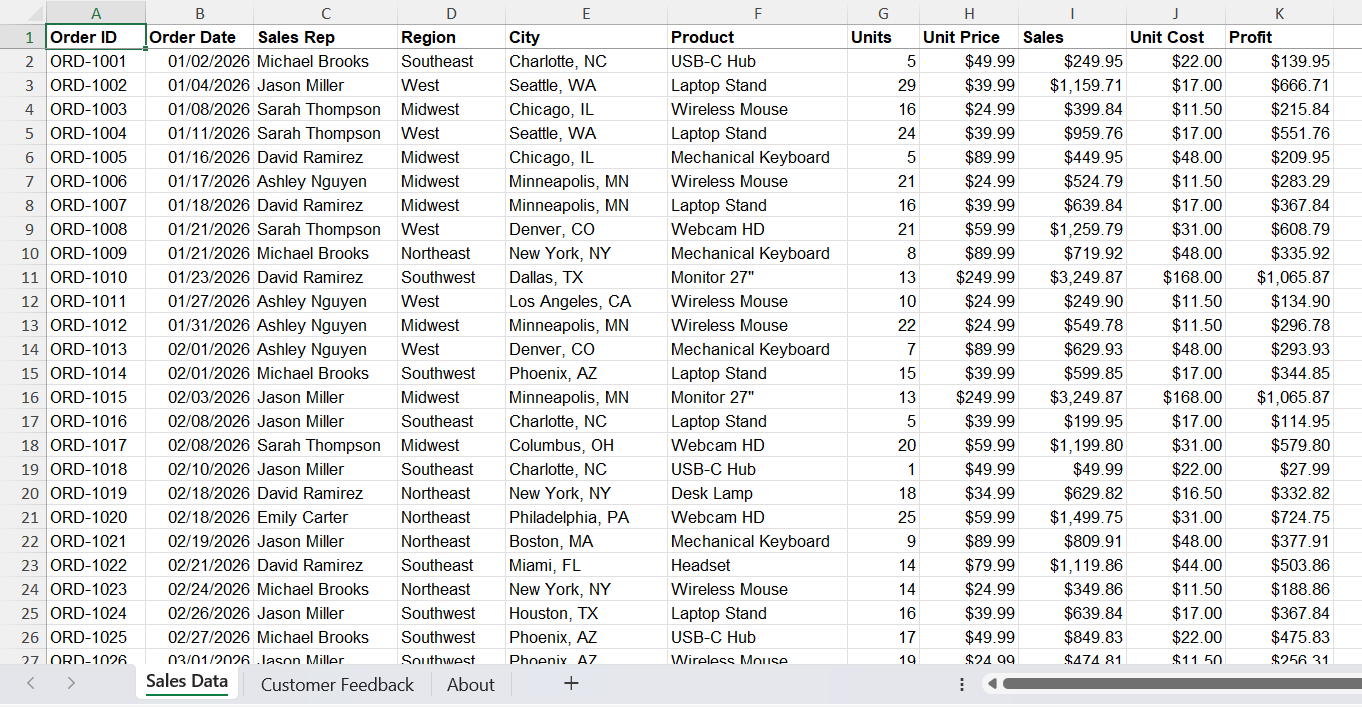
STEP 1: Open the Excel workbook containing the data you want to analyze.
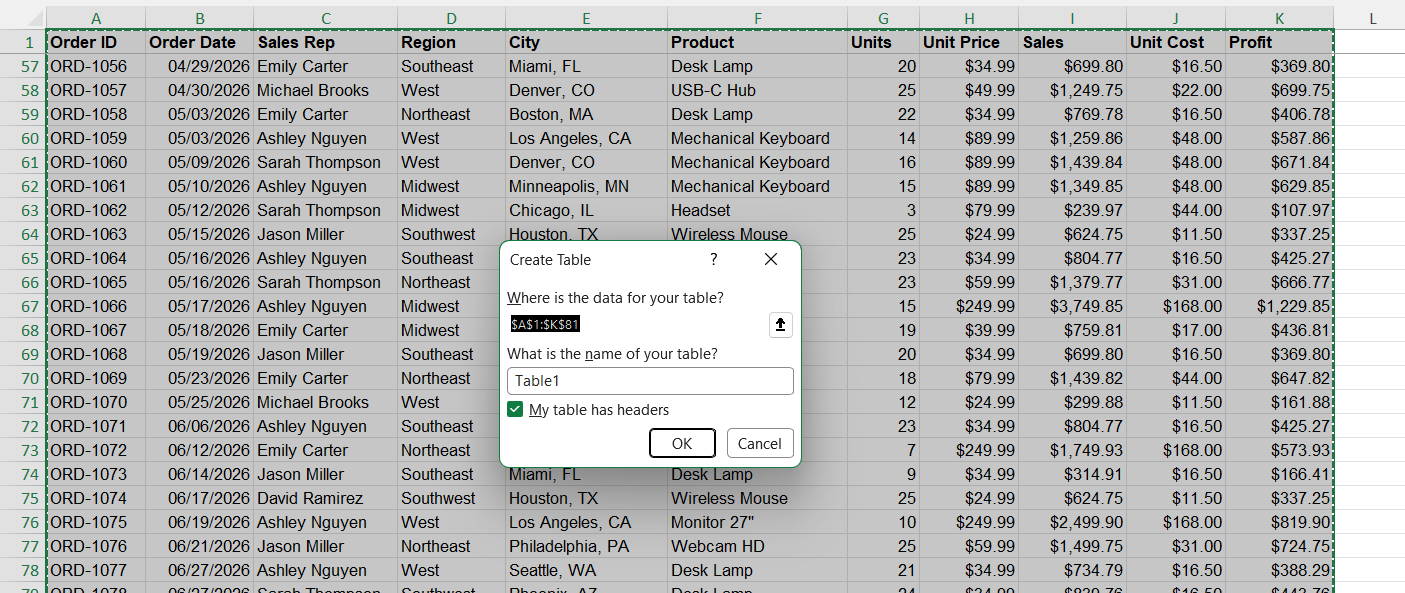
STEP 2: Press Ctrl + T to convert data to a table.
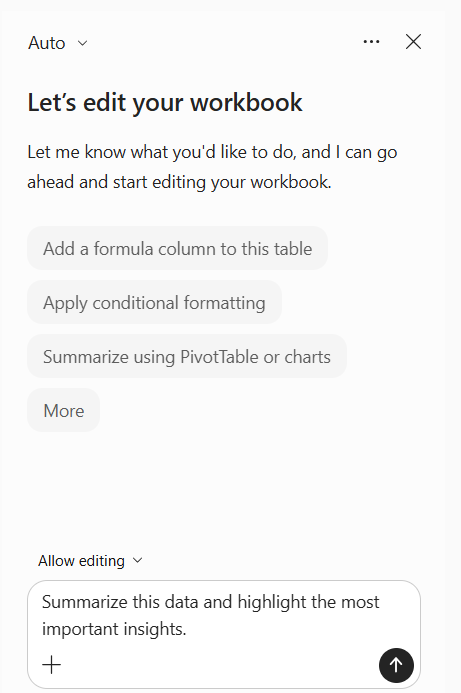
STEP 3: Go to the Home tab and select Copilot.

STEP 4: In the Copilot chat panel, type the prompt:
Summarize this data and highlight the most important insights.
STEP 5: Review the result and press Done.
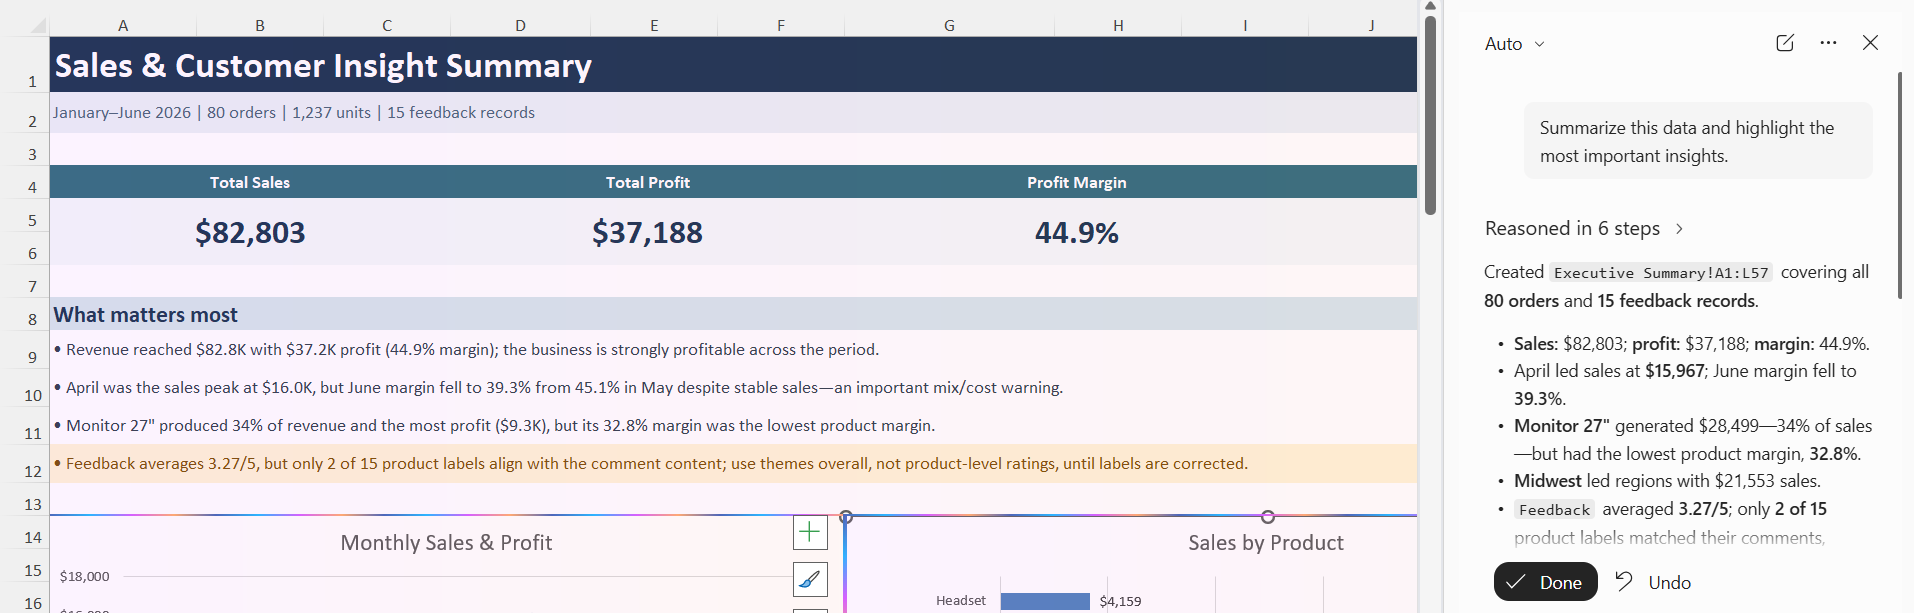
Common Copilot Prompts
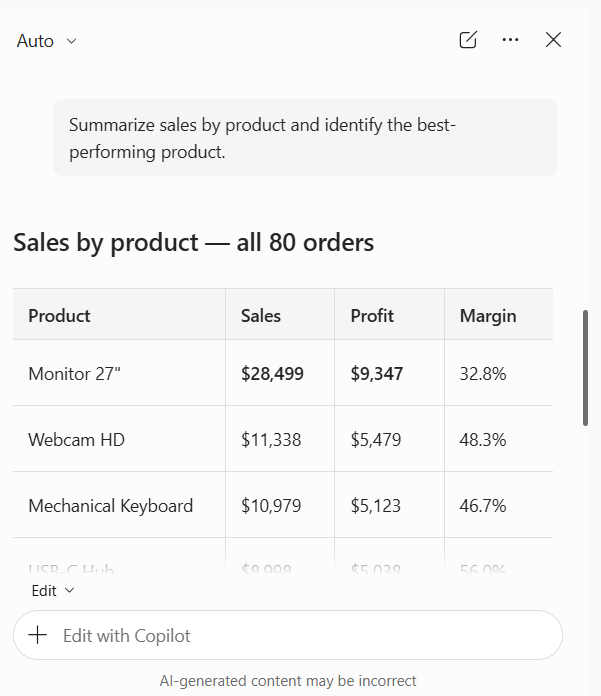
- Summarize sales by product and identify the best-performing product.
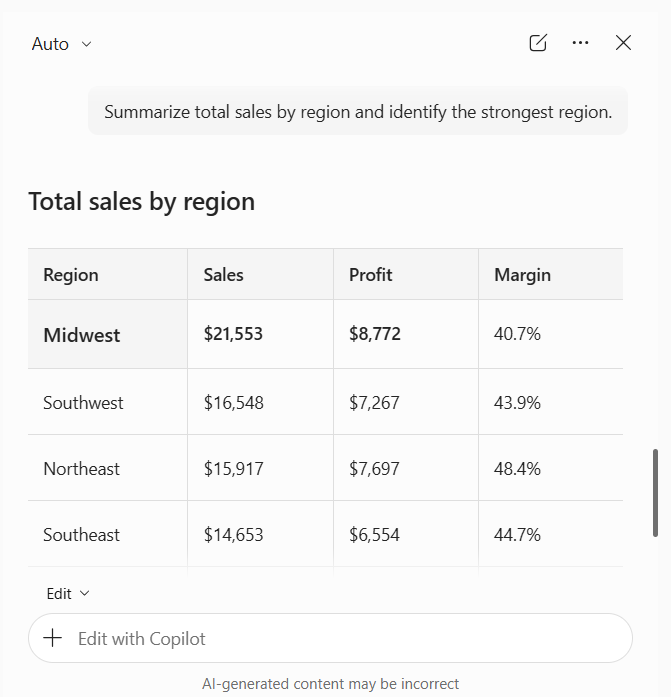
- Summarize total sales by region and identify the strongest region.
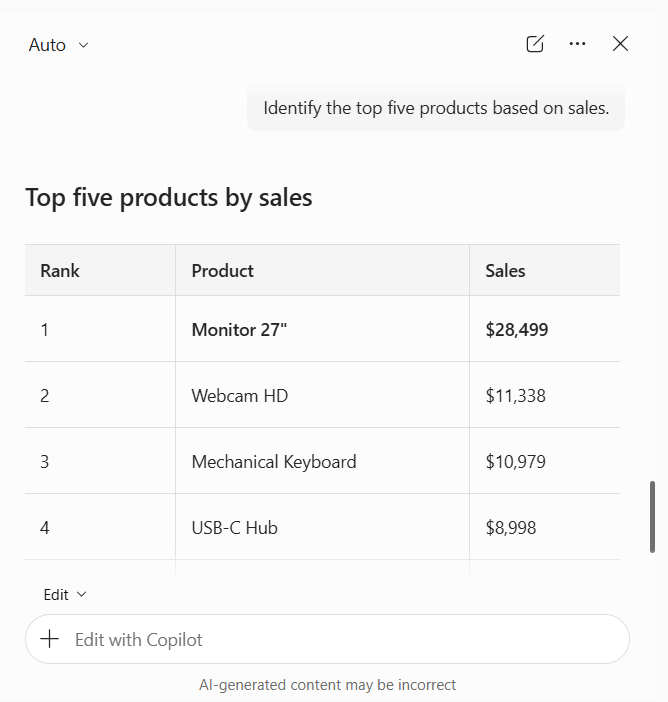
- Identify the top five products based on sales.
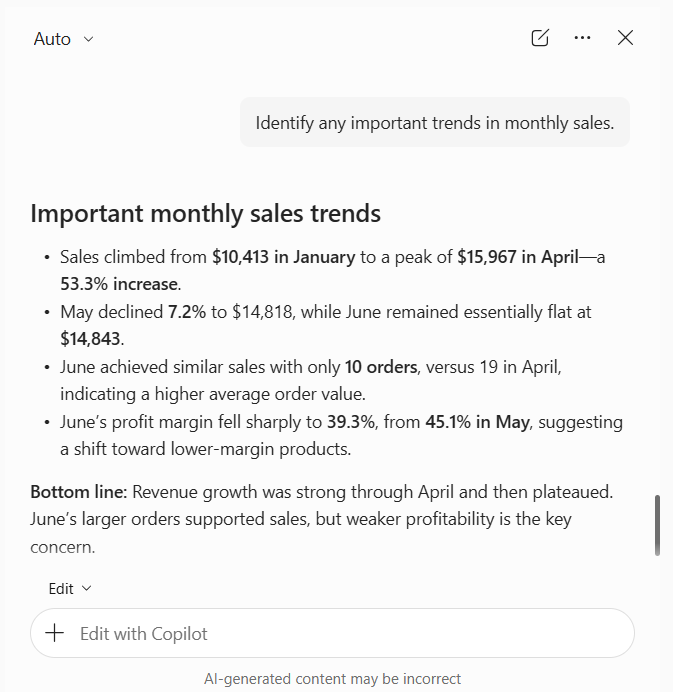
- Identify any important trends in monthly sales.
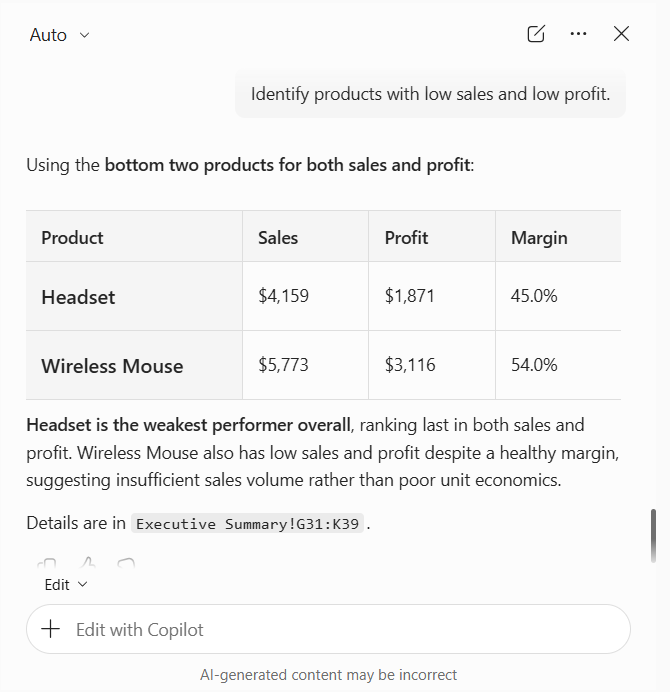
- Identify products with low sales and low profit.
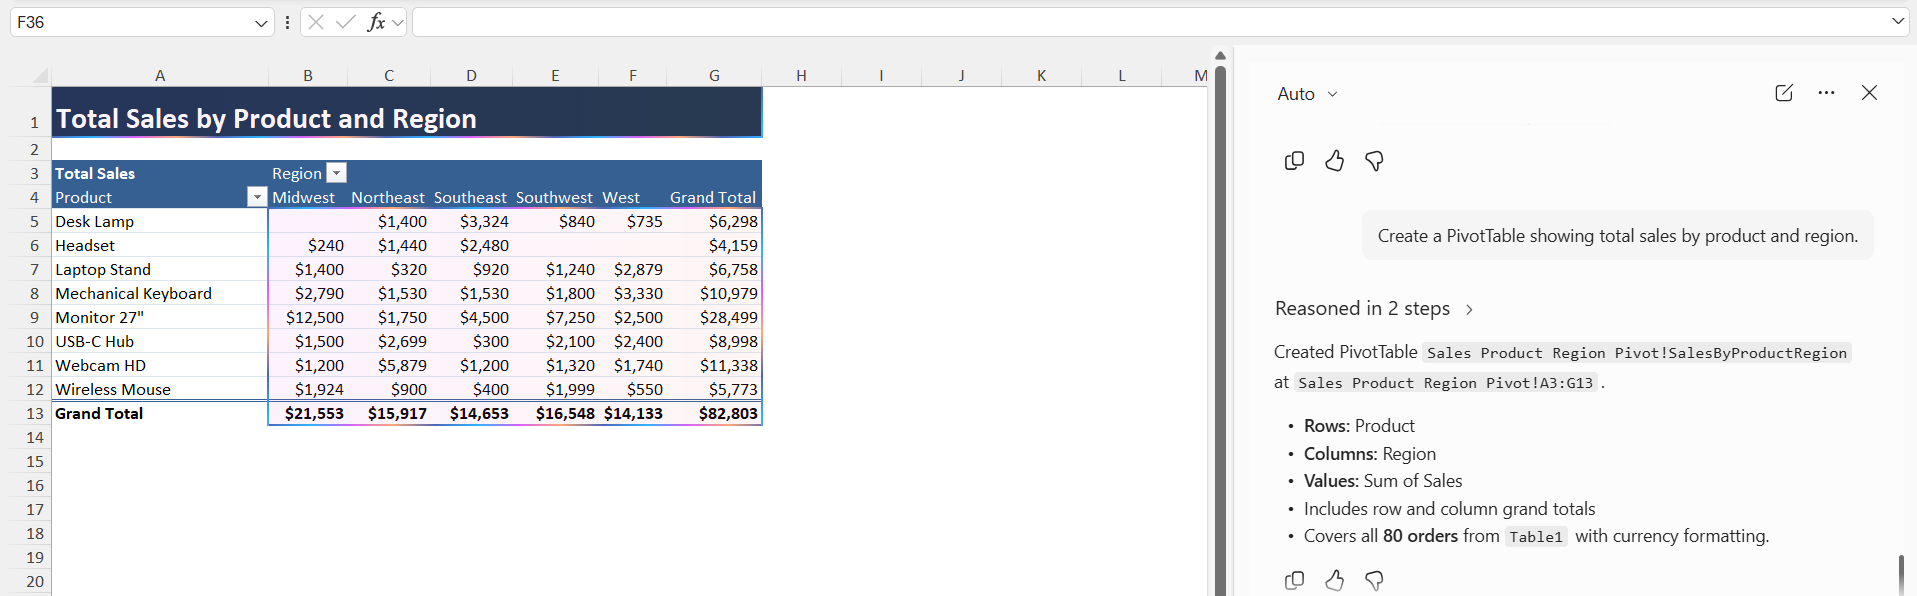
- Create a PivotTable showing total sales by product and region.
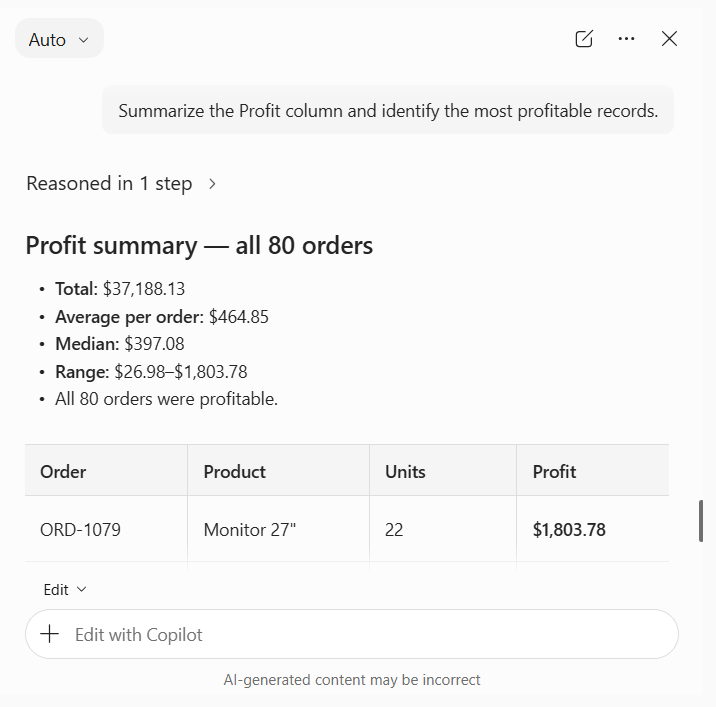
- Summarize the Profit column and identify the most profitable records.
Tips & Tricks
Before asking Copilot to summarize your data, make sure the information is clean and organized. Use meaningful column headers and keep similar types of information in the same column. Start with a general prompt, then ask more specific follow-up questions. For example, first ask Copilot to summarize the entire dataset. Then, ask it to identify the best-performing product or the weakest region.
It also helps to specify the type of result you want. You can ask for a summary, a list of key insights, a comparison, a PivotTable, or a chart. This gives Copilot a clearer idea of what you want to achieve.
Finally, always review important calculations and insights. Copilot can help speed up the analysis process, but you should verify the results against your original data when accuracy is important.
FAQs
1. Can Copilot summarize large amounts of Excel data?
Yes. Microsoft Copilot can help summarize large datasets and identify important information, such as totals, trends, patterns, and top-performing categories.
2. Can I ask Copilot to summarize a specific column?
Yes. You can ask Copilot to summarize a specific column, such as Sales, Profit, Region, or customer feedback.
3. Can Copilot summarize data by category?
Yes. You can ask Copilot to summarize data by product, region, vendor, status, or other categories in your dataset.
4. Can I ask follow-up questions after getting a summary?
Yes. You can continue asking questions to explore specific results and analyze the data in more detail.
5. Do I need to format my data as a table?
It is recommended to organize your data clearly and convert it into a table. This can make the data easier for Copilot to understand and analyze.

John Michaloudis is a former accountant and finance analyst at General Electric, a Microsoft MVP since 2020, an Amazon #1 bestselling author of 4 Microsoft Excel books and teacher of Microsoft Excel & Office over at his flagship MyExcelOnline Academy Online Course.

 30 Days - Full Access